Data
This page presents original surveys and research conducted by The Third Family in collaboration with academics and researchers.
For Researchers
Papers & Reports
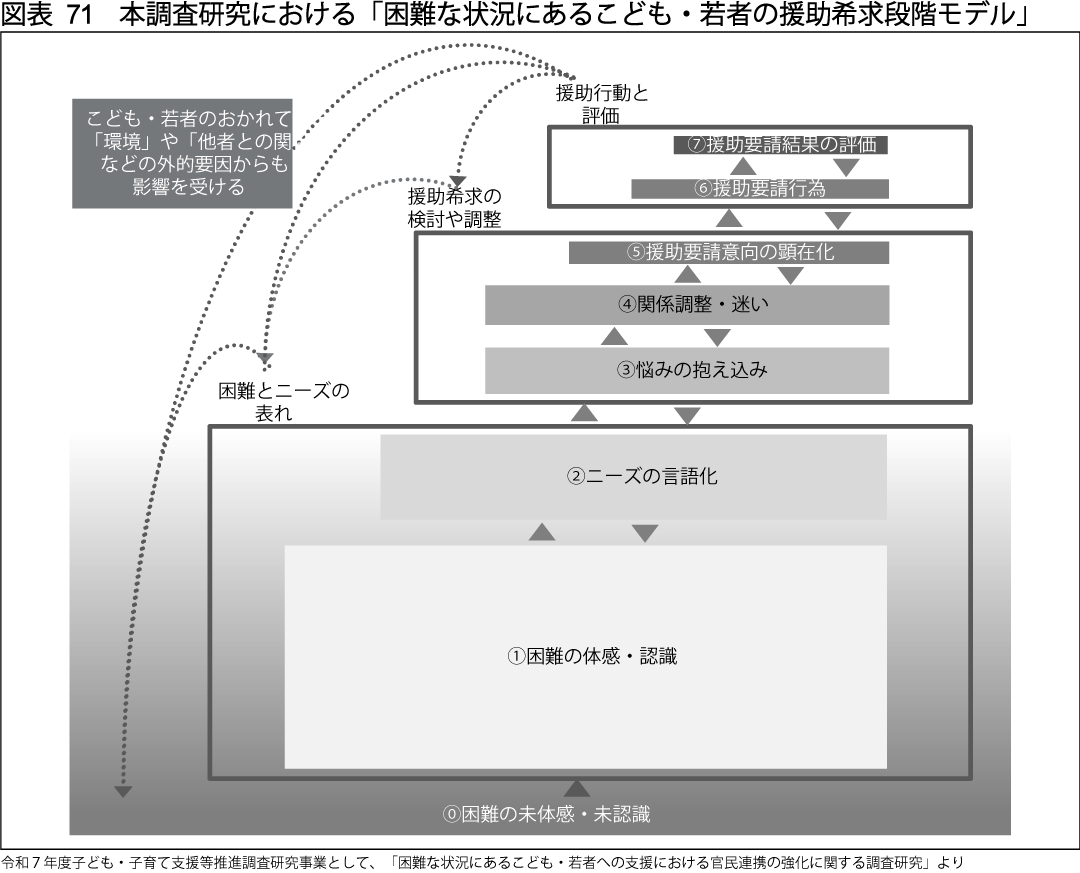
- (Cooperation) FY2025 Child and Child-rearing Support Promotion Research Project: “Research on Strengthening Public-Private Partnerships in Support for Children and Young People in Difficult Circumstances”
- (Cooperation) FY2025 Children and Families Agency Subsidy Project: “Research on Multifaceted Factor Analysis of Child Suicide”
- User survey of “NPO The Third Family,” a safe space for struggling teenagers: high rates of single-parent households, cram school use, and daycare use; low rates of dual-income households. (2026)
- (Summary) Analysis of psychological abuse based on bulletin board post data — Shohei Tada, Aoyama Gakuin University (2026)
- (Full text) Analysis of psychological abuse based on bulletin board post data — Shohei Tada, Aoyama Gakuin University (2026)
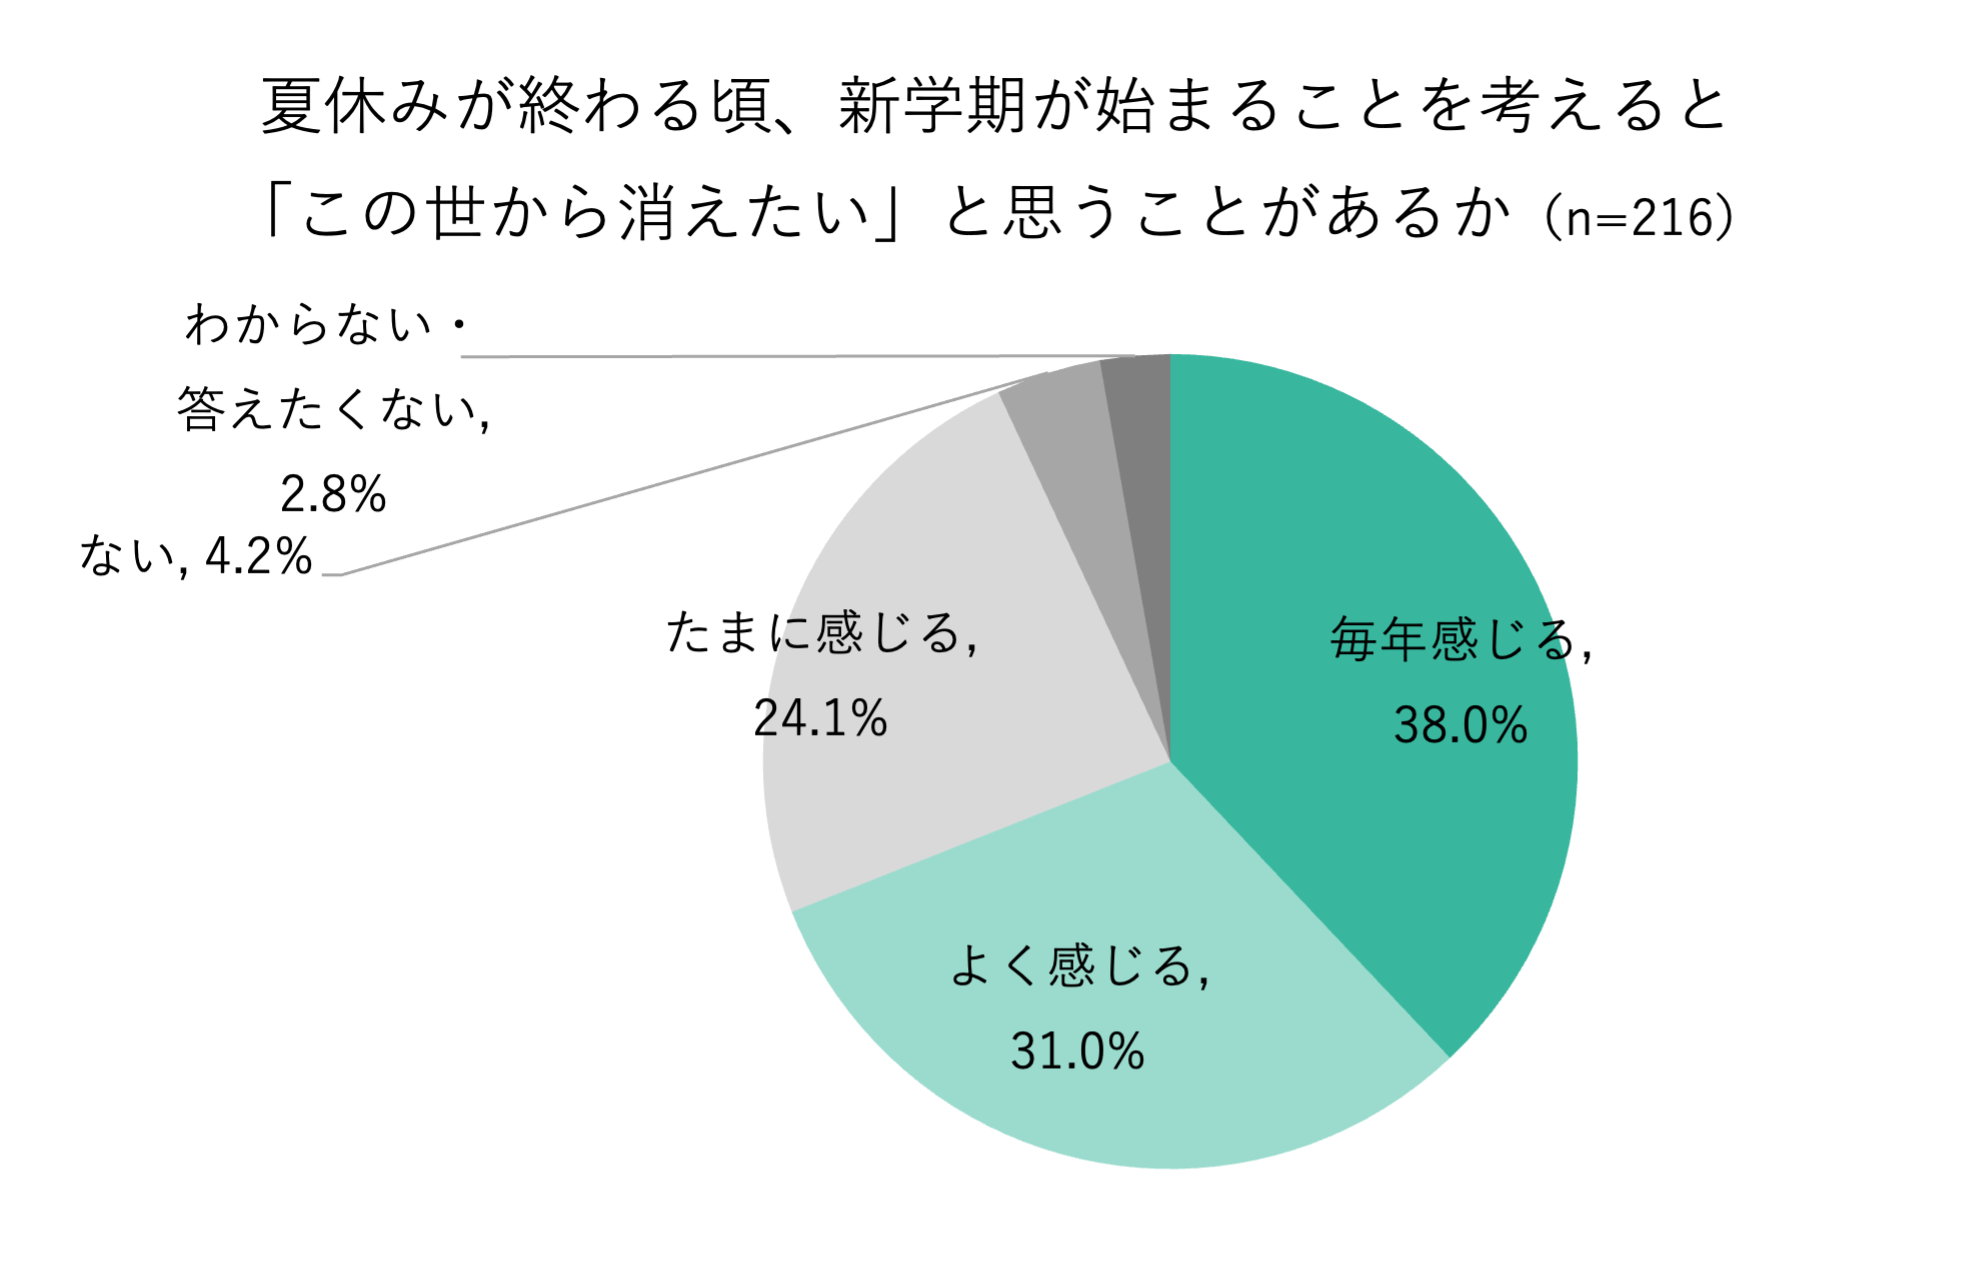
- 93.1% of teenagers who find school “painful” have felt like disappearing from this world as summer break ends — survey of 216 teenagers (2025)
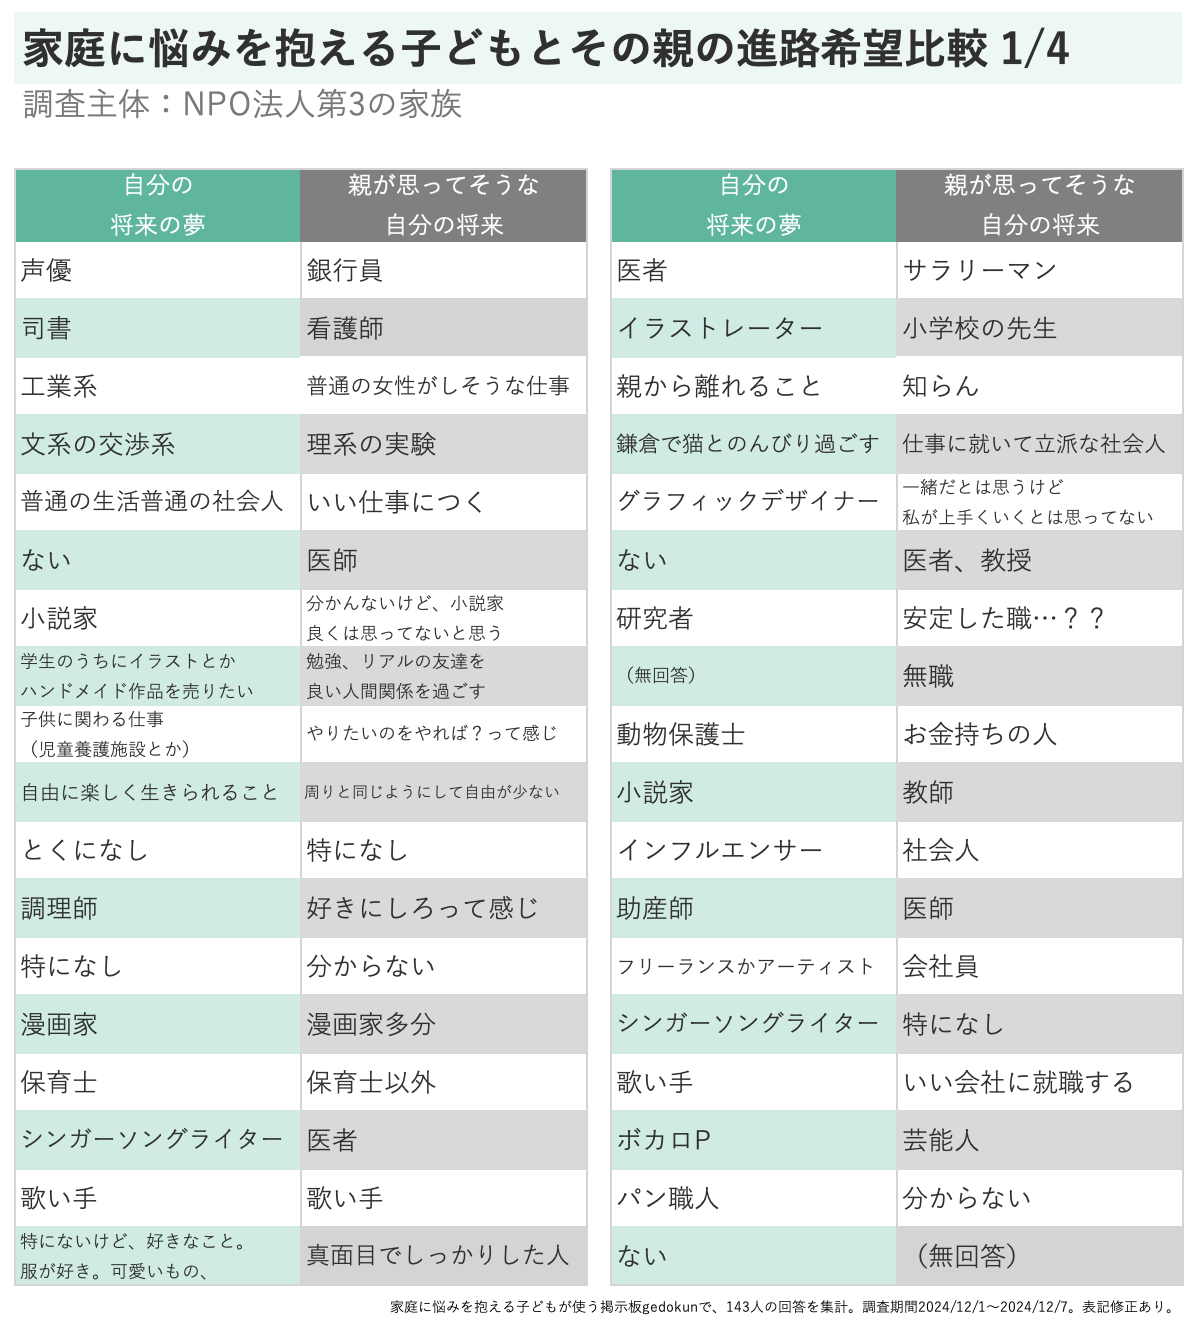
- [Exam season] 93.8% of children with family environment struggles report differences between their own and their parents' career aspirations (2024)
Summary
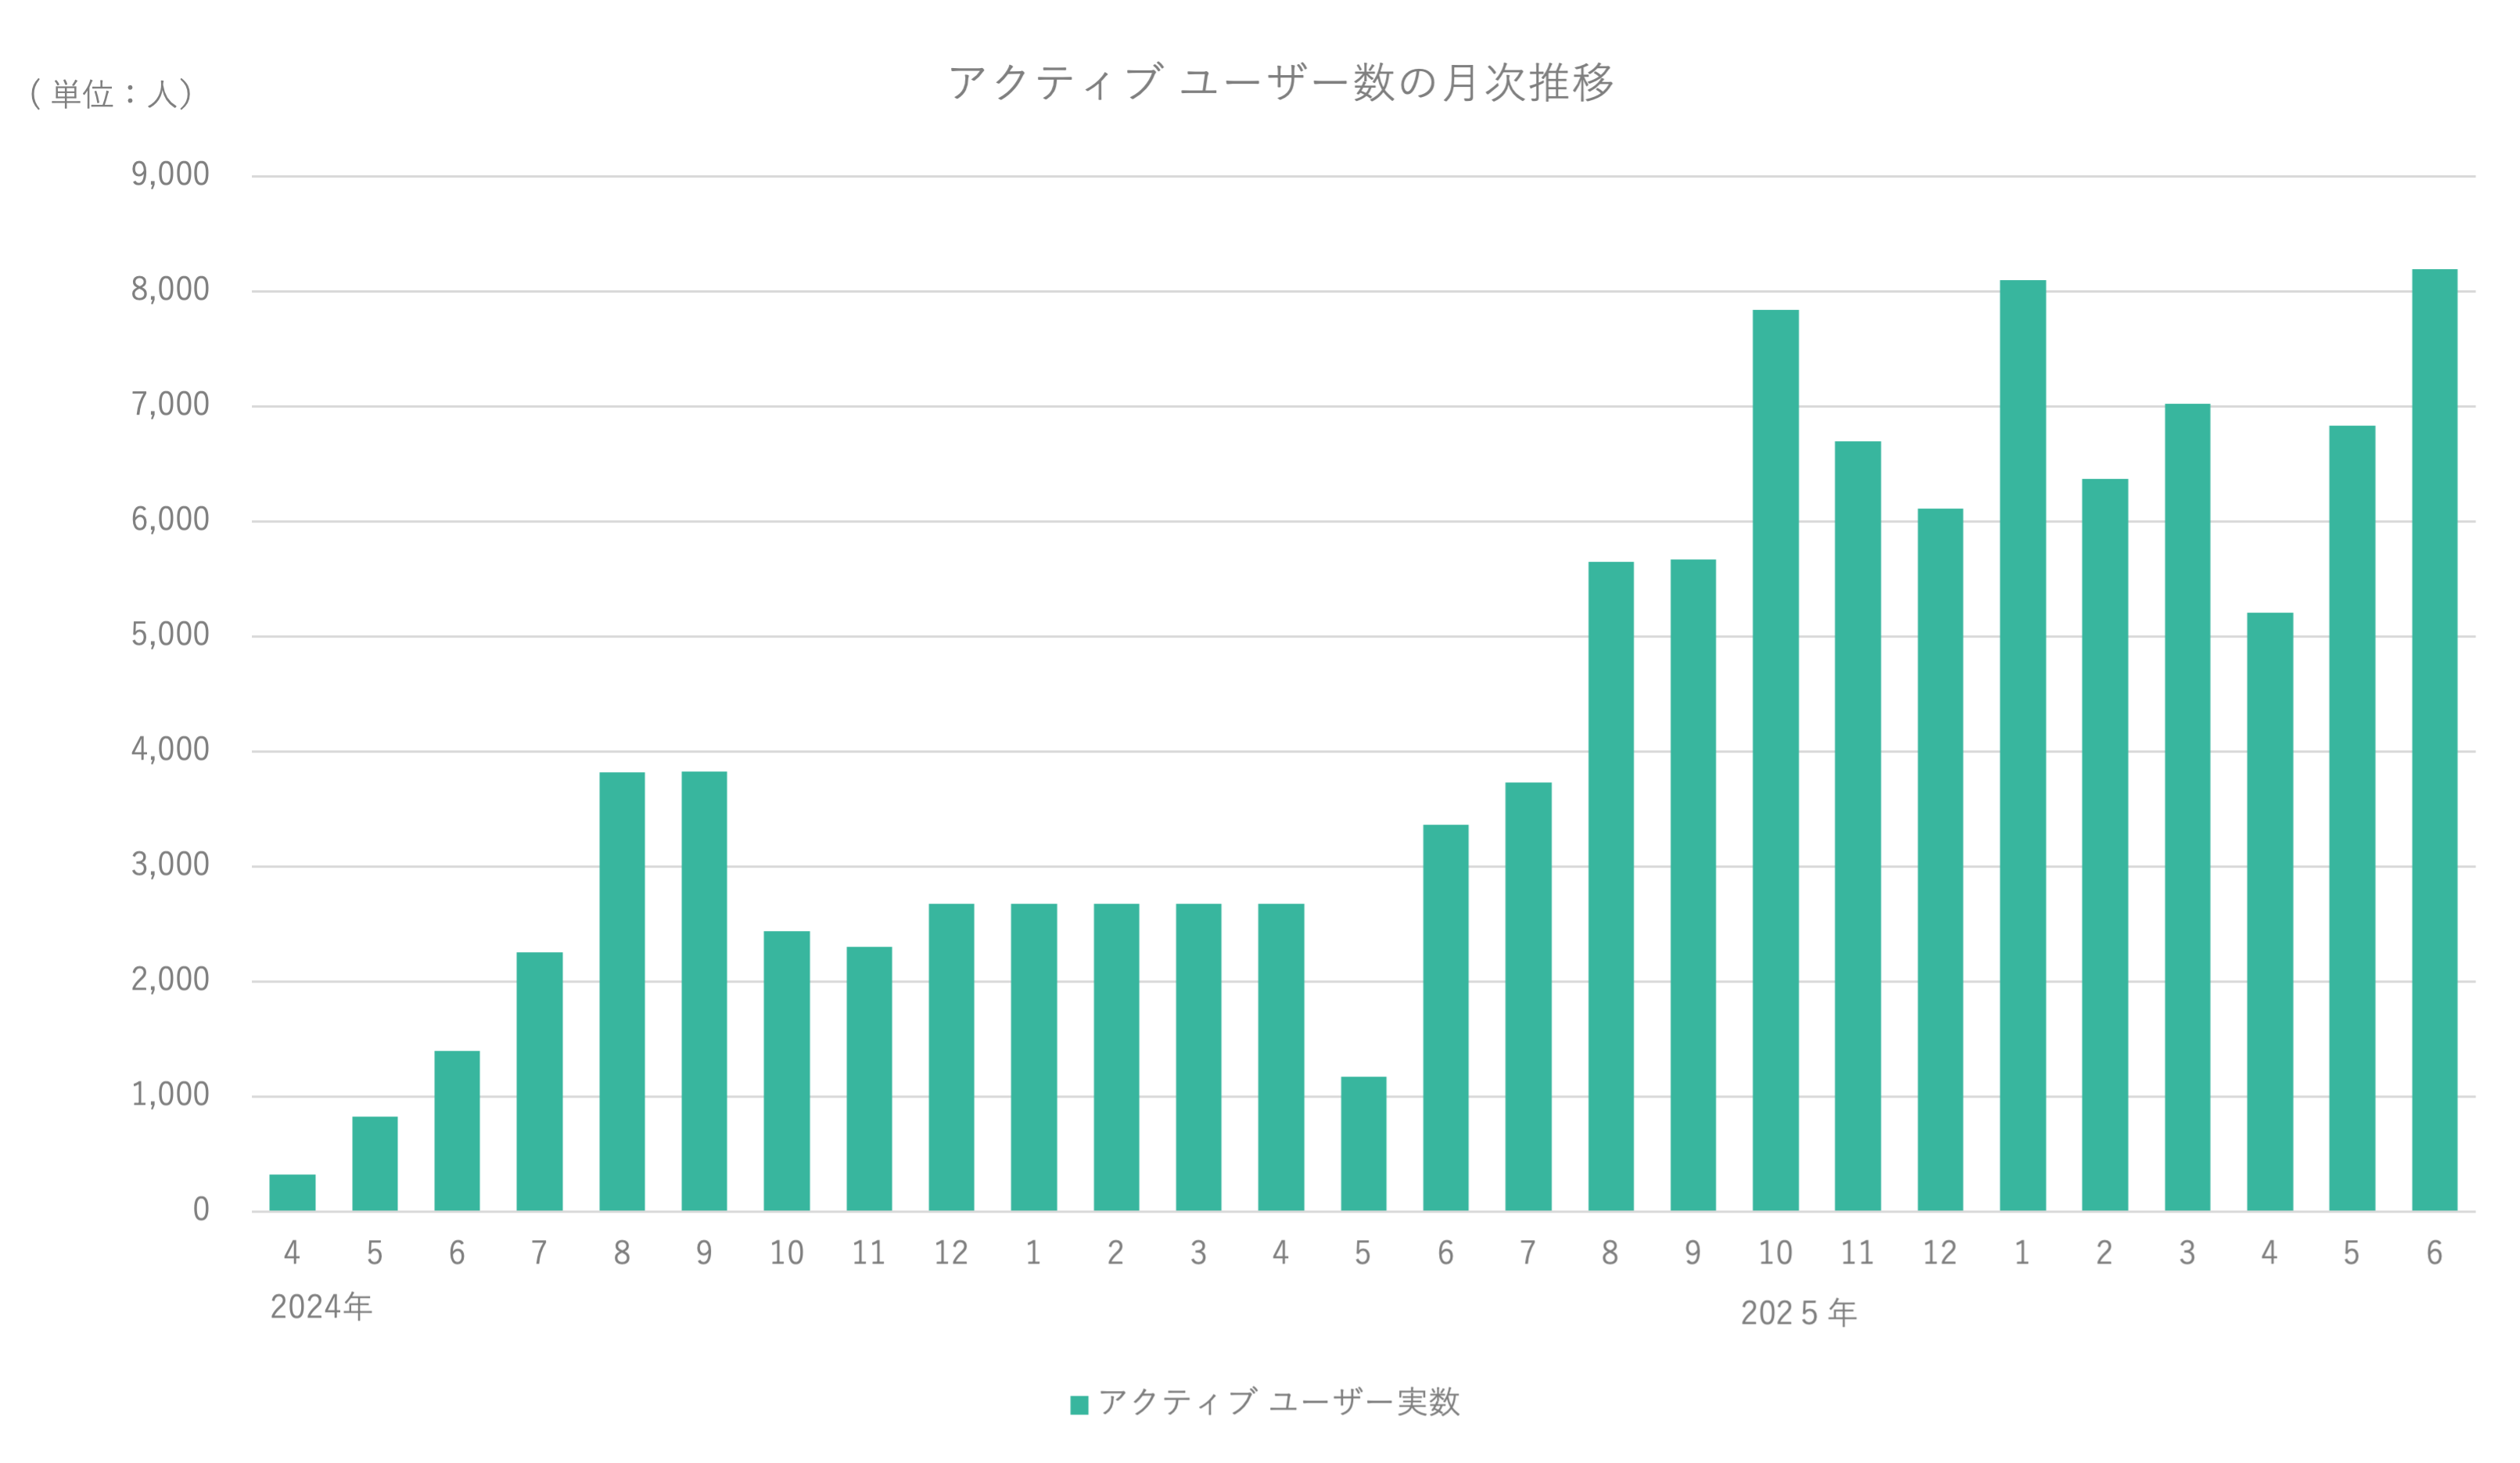
Active Users
120,000 total users, 7,000 monthly active users.
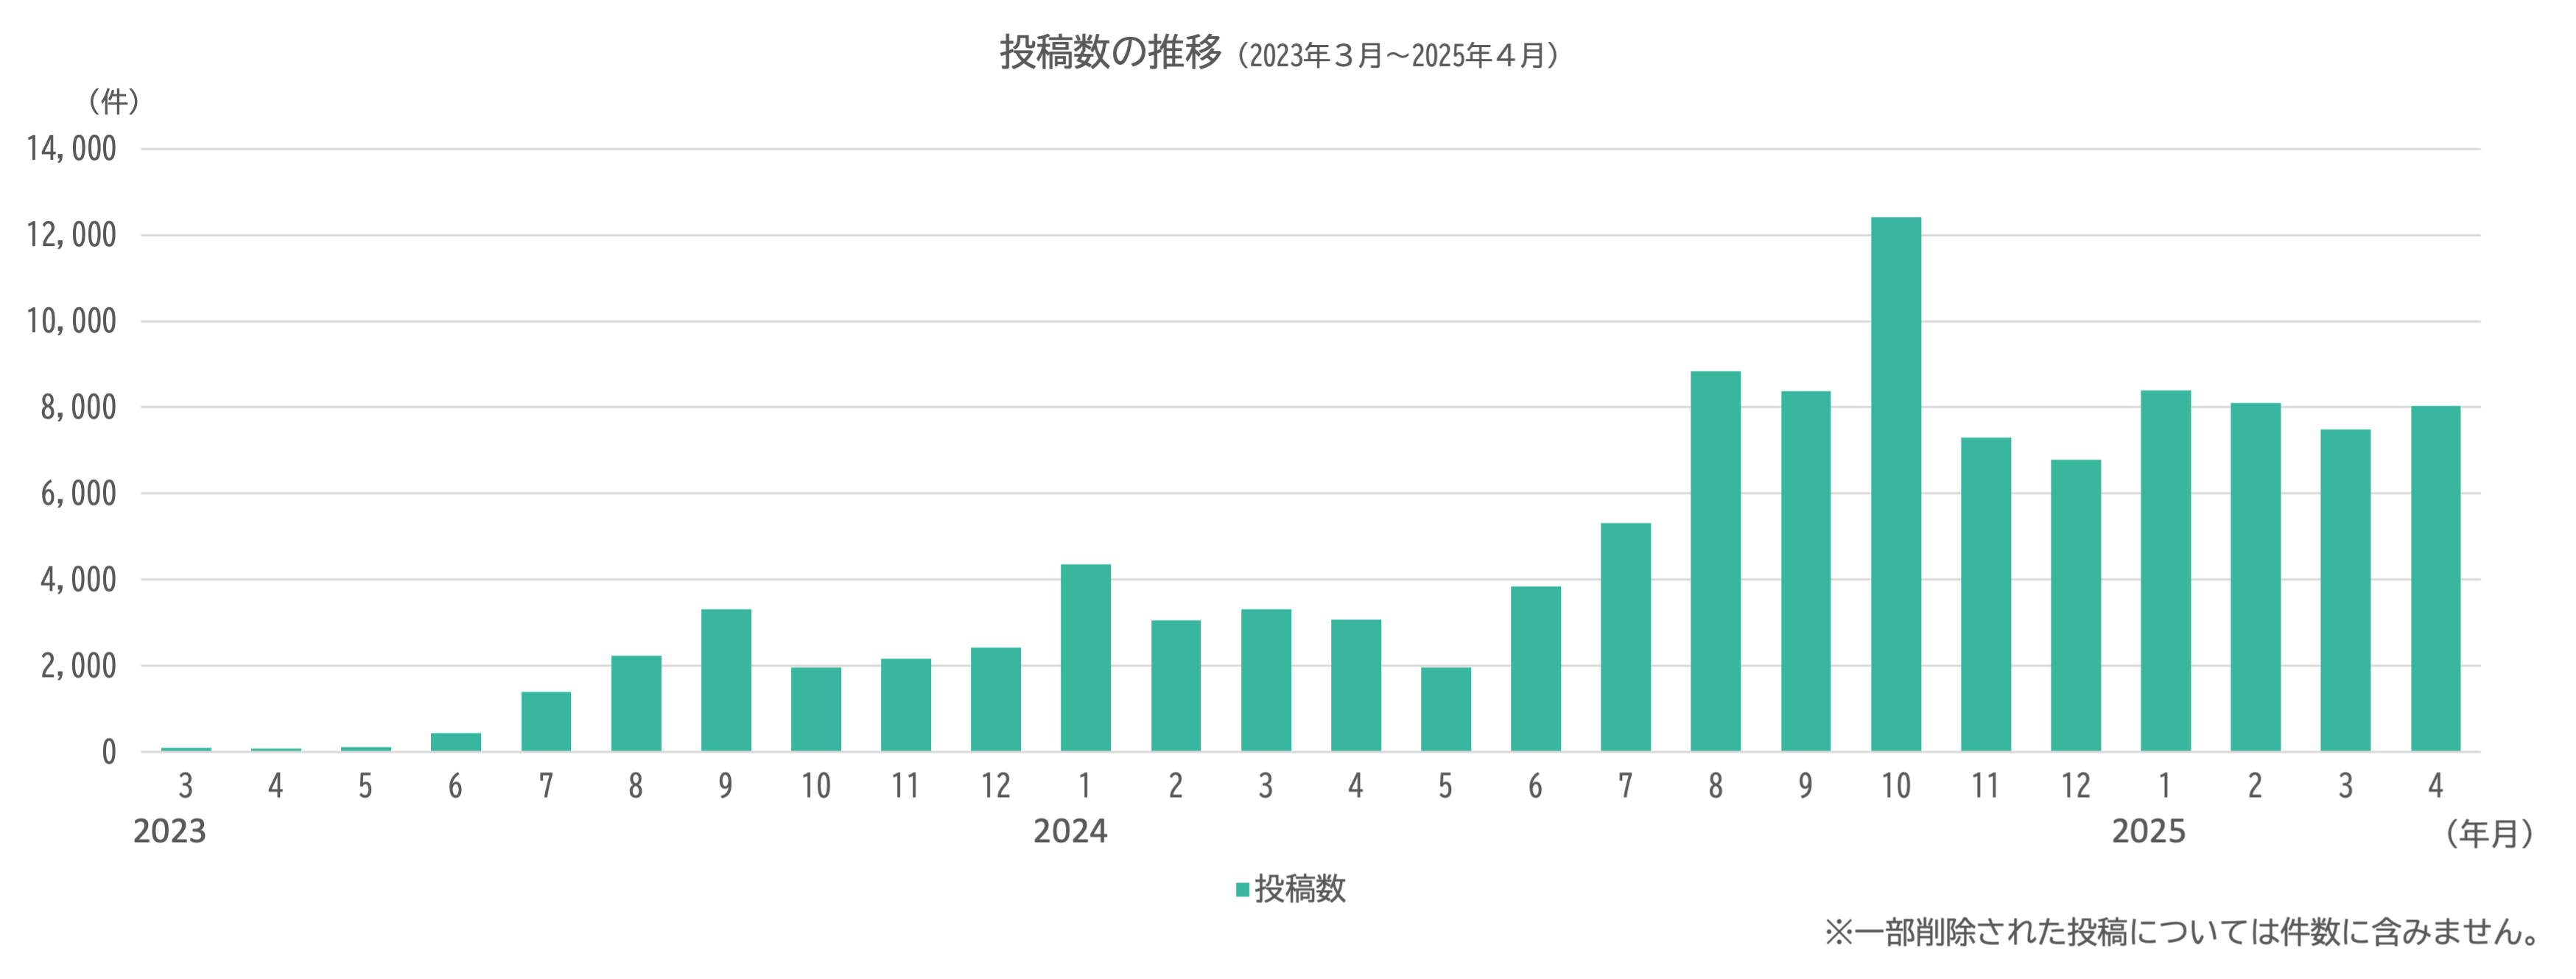
Post Volume Over Time
Increasing year over year.
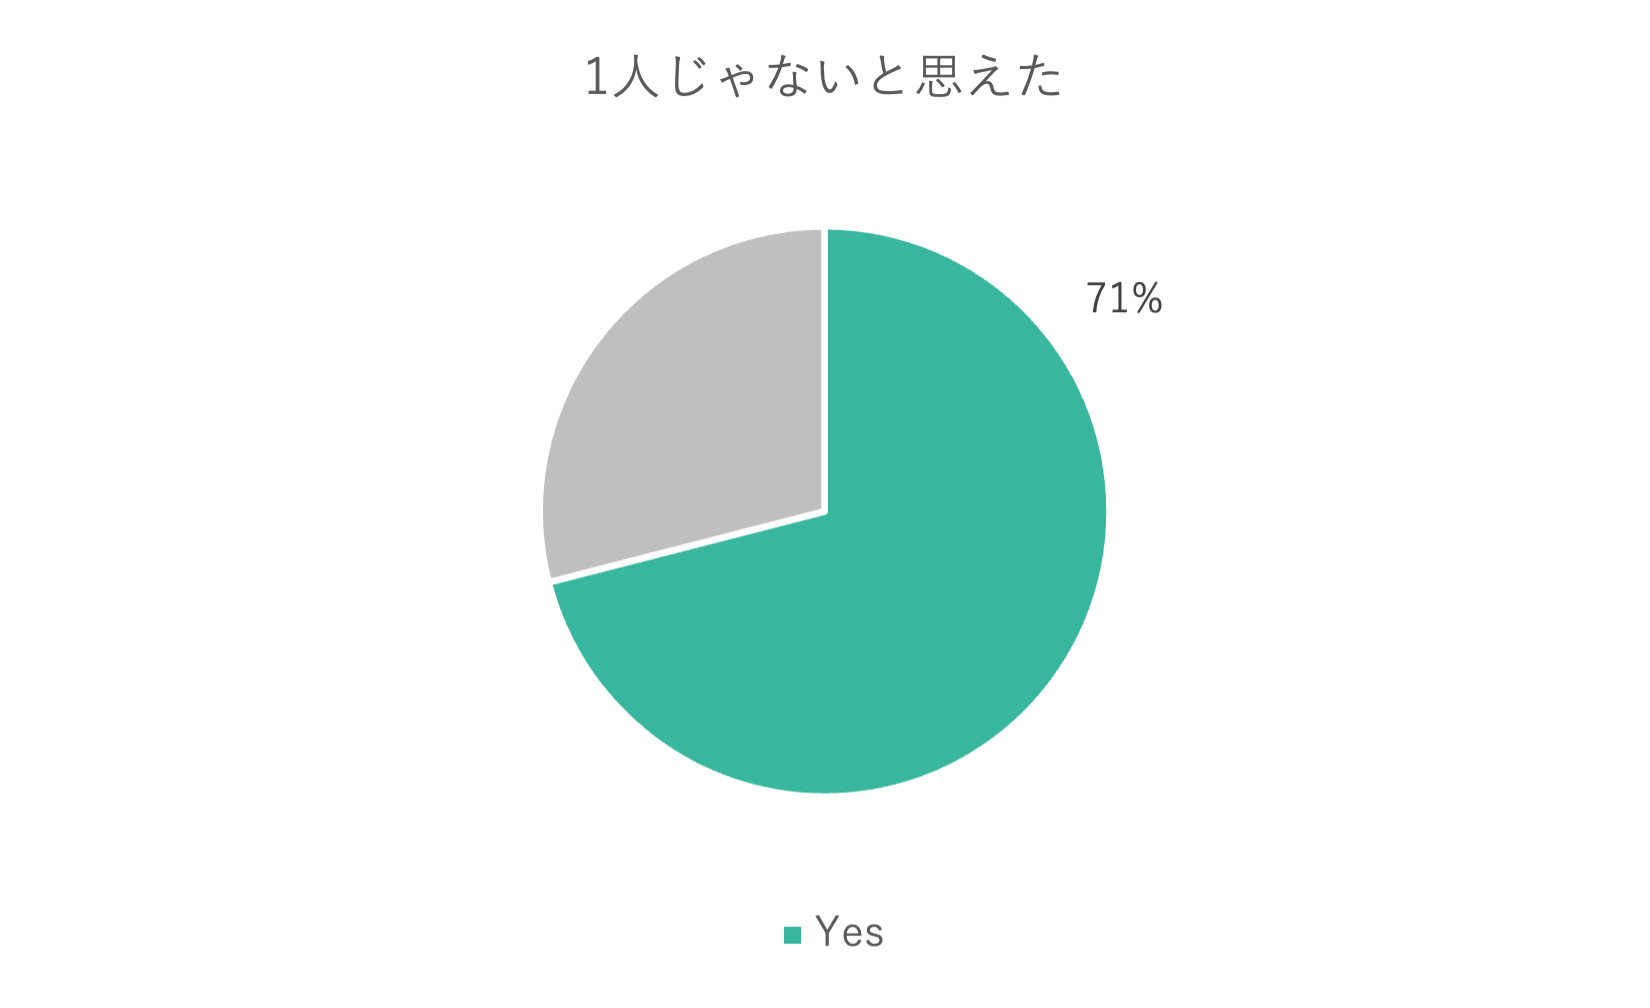
Feeling that they are not alone
Voluntary survey results (N=486) (as of February 2025)
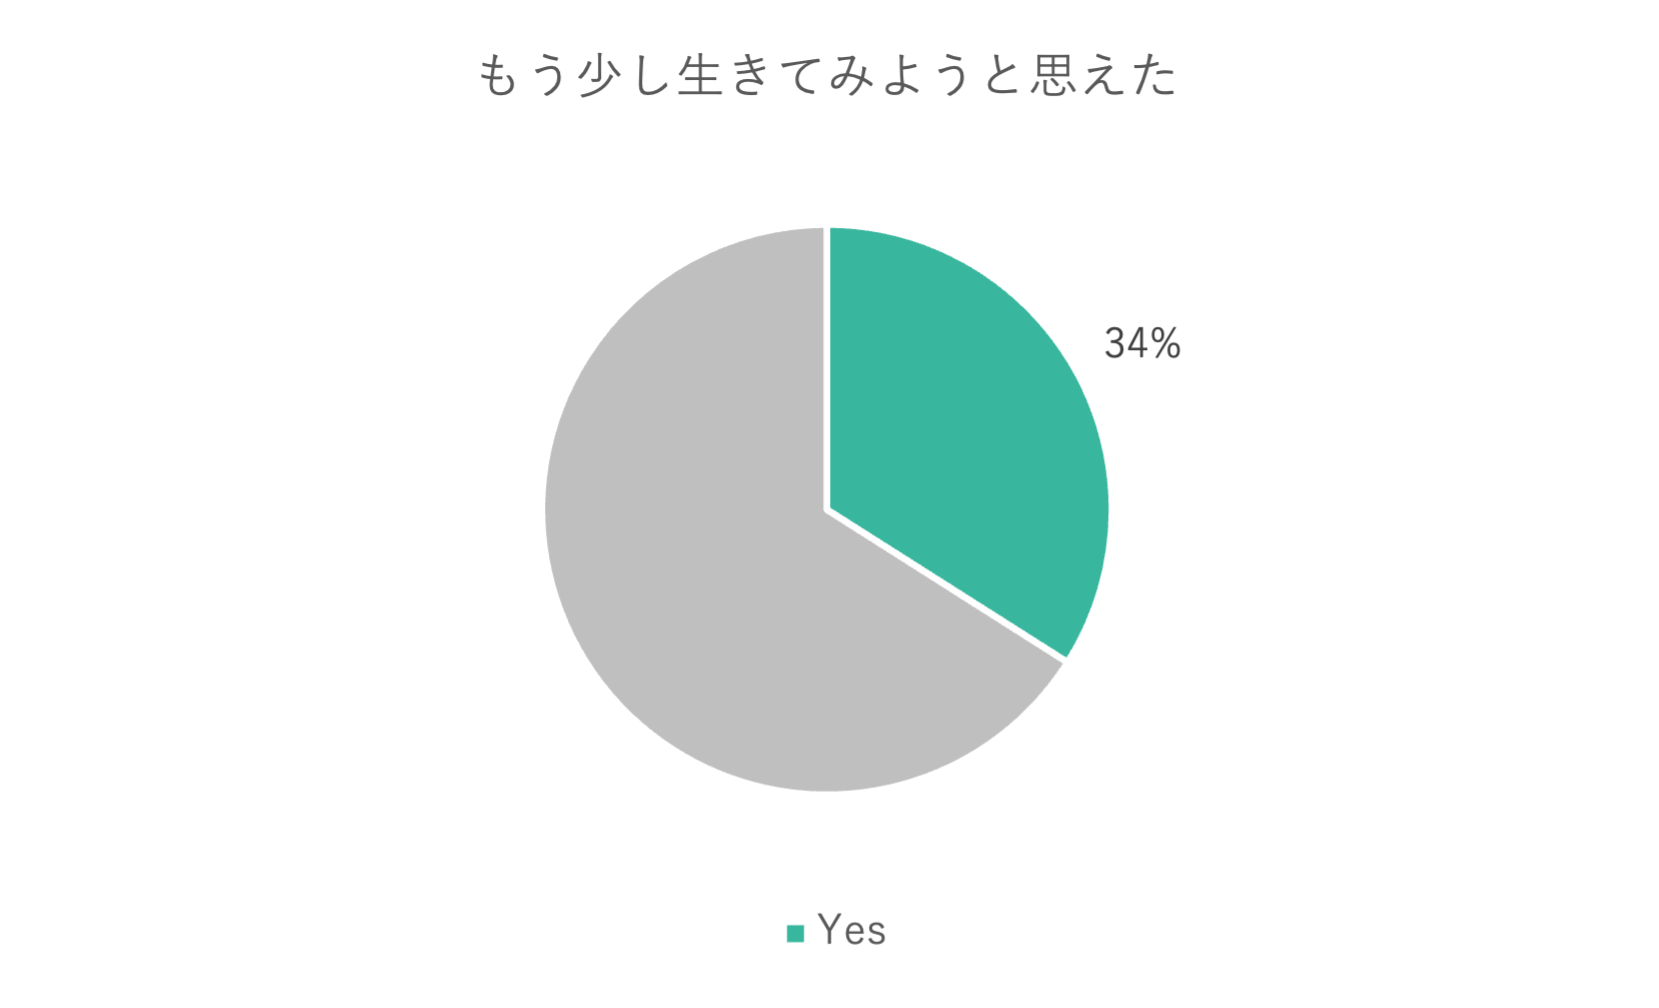
Feeling able to keep living a little longer
Voluntary survey results (N=486) (as of February 2025)
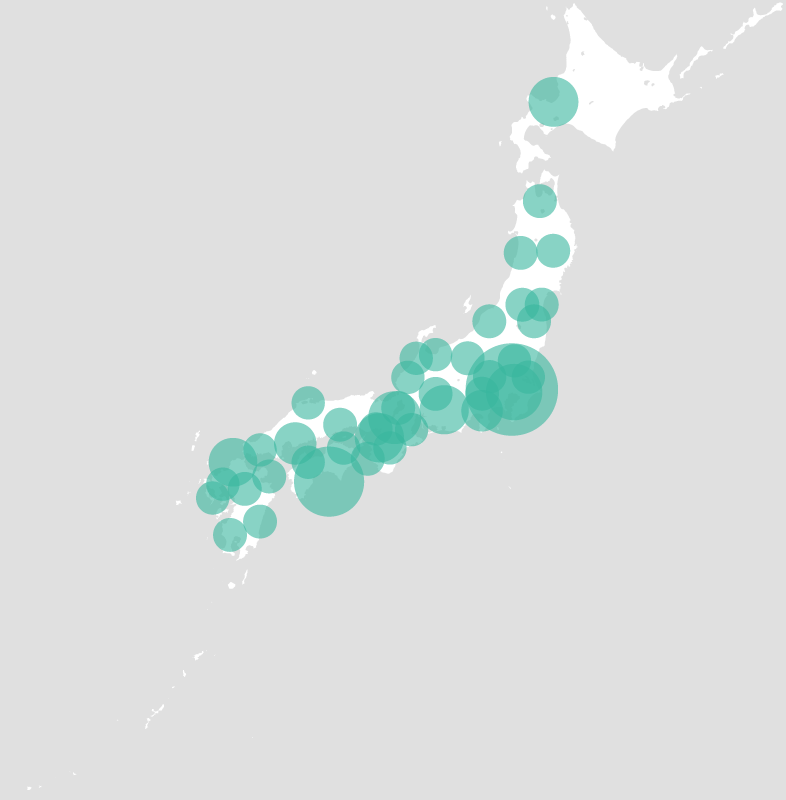
User Distribution
Mapped high-usage regions (as of May 2025). Users from all over Japan.
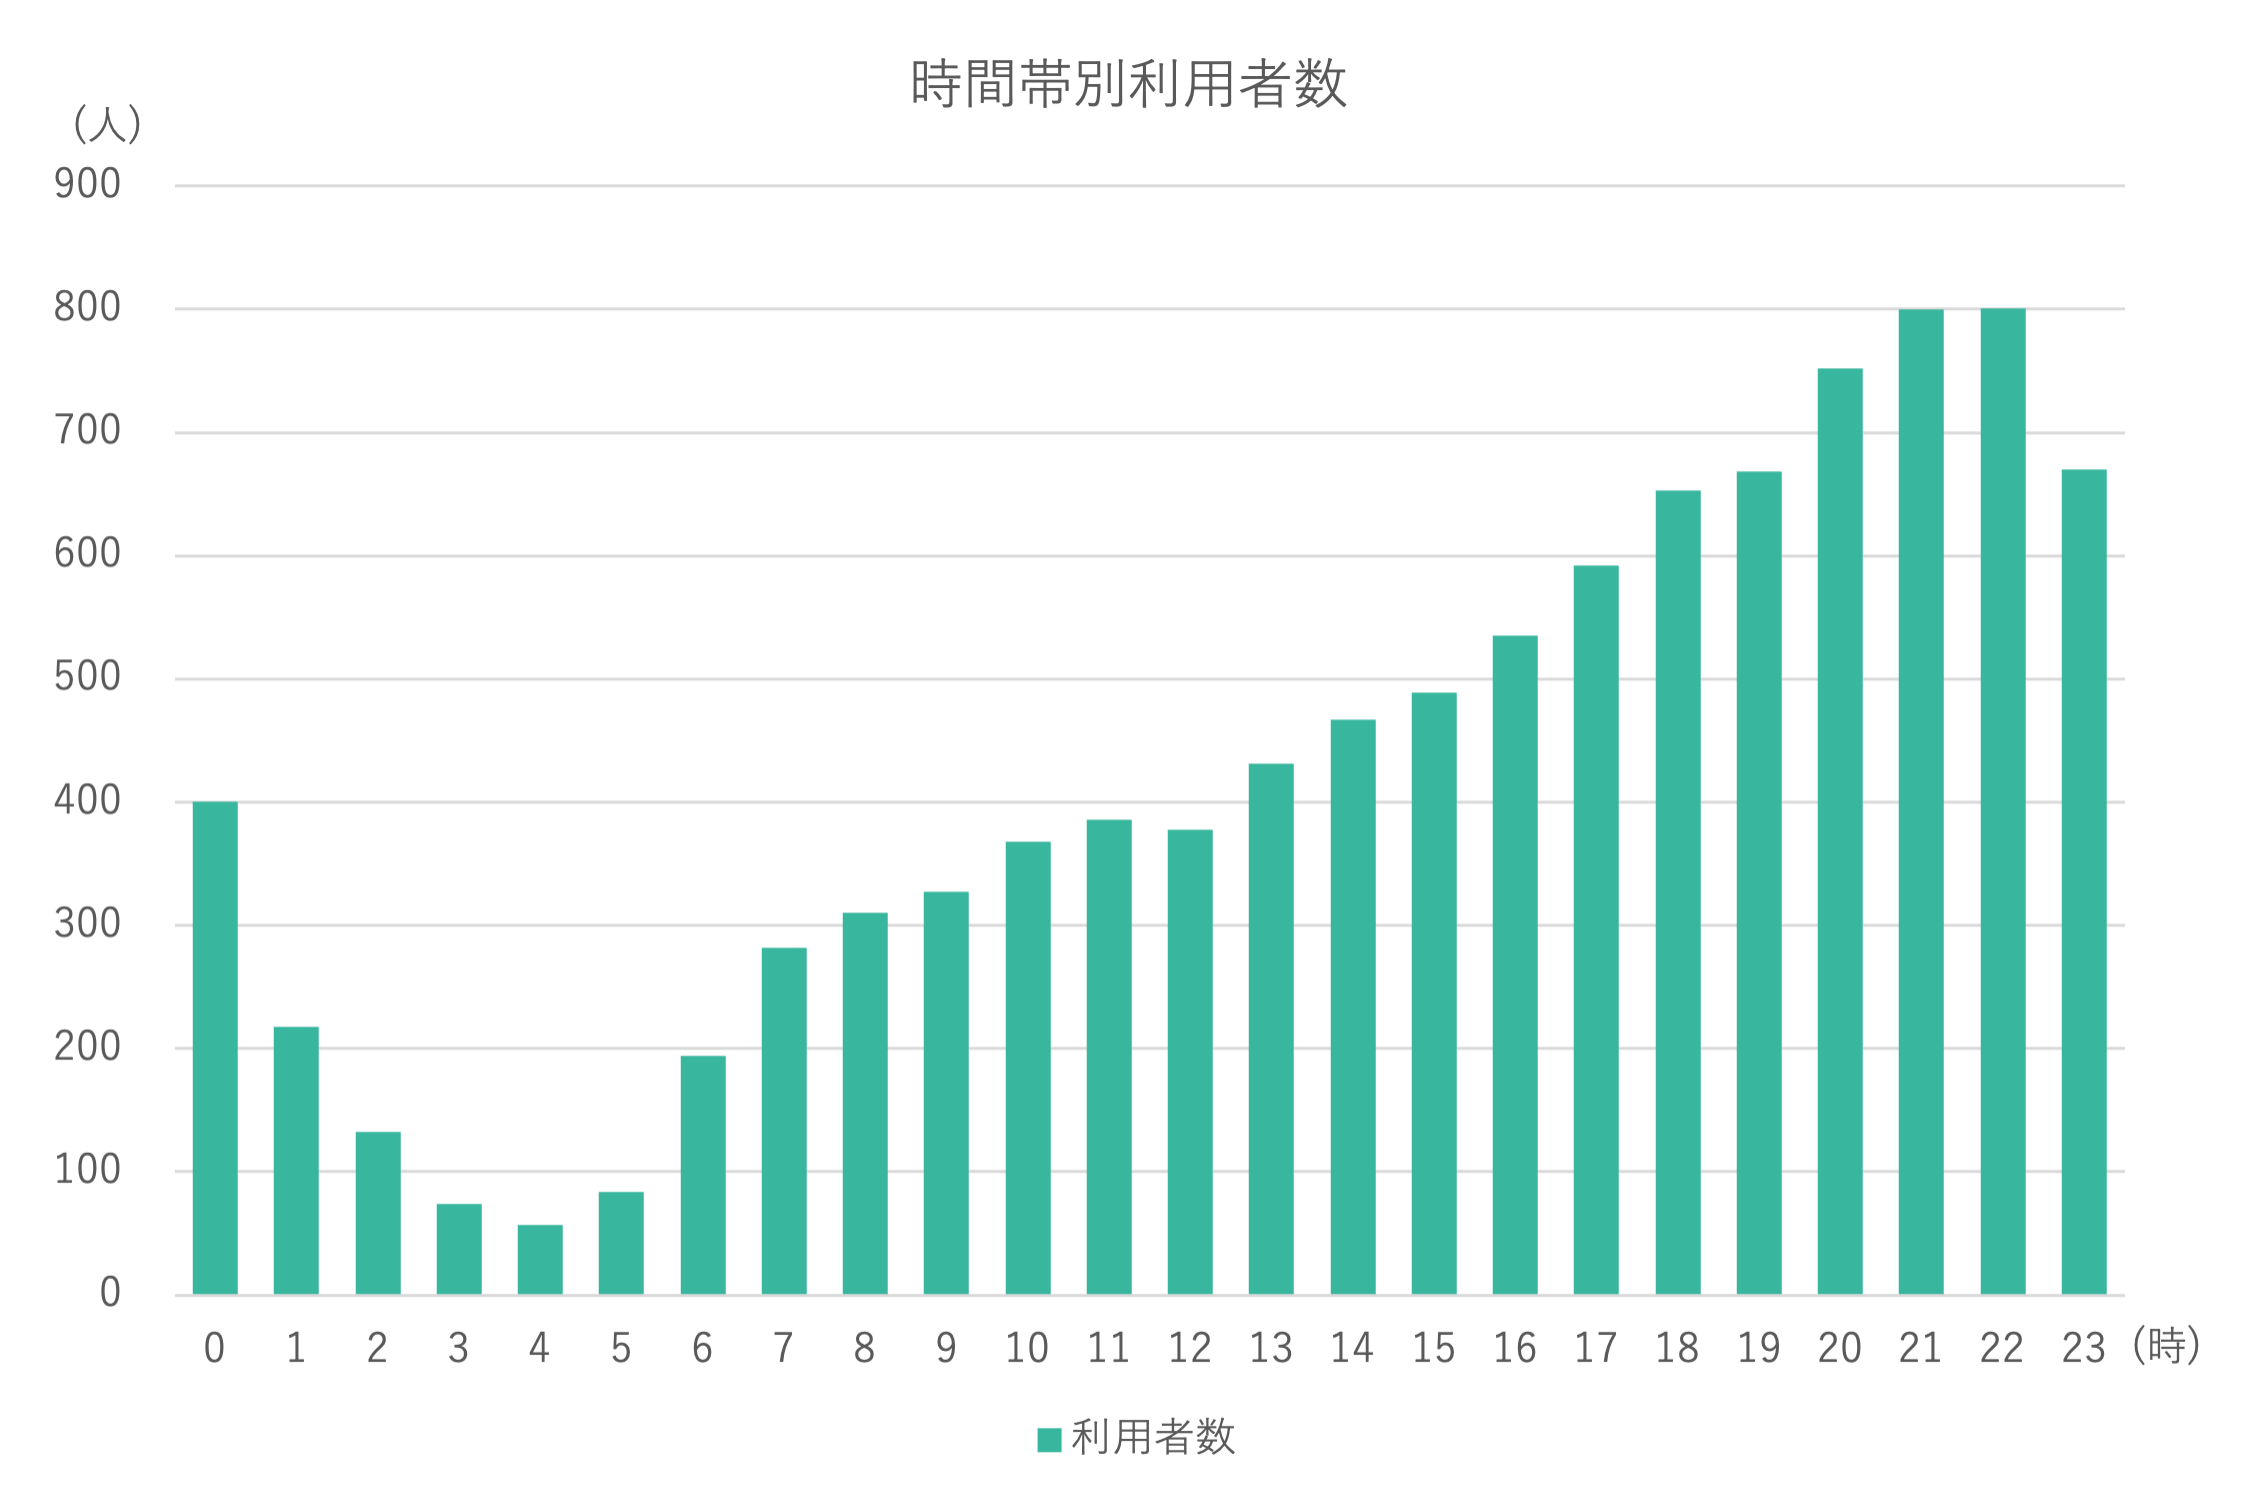
Usage by Time of Day
High usage at night (as of May 2025).
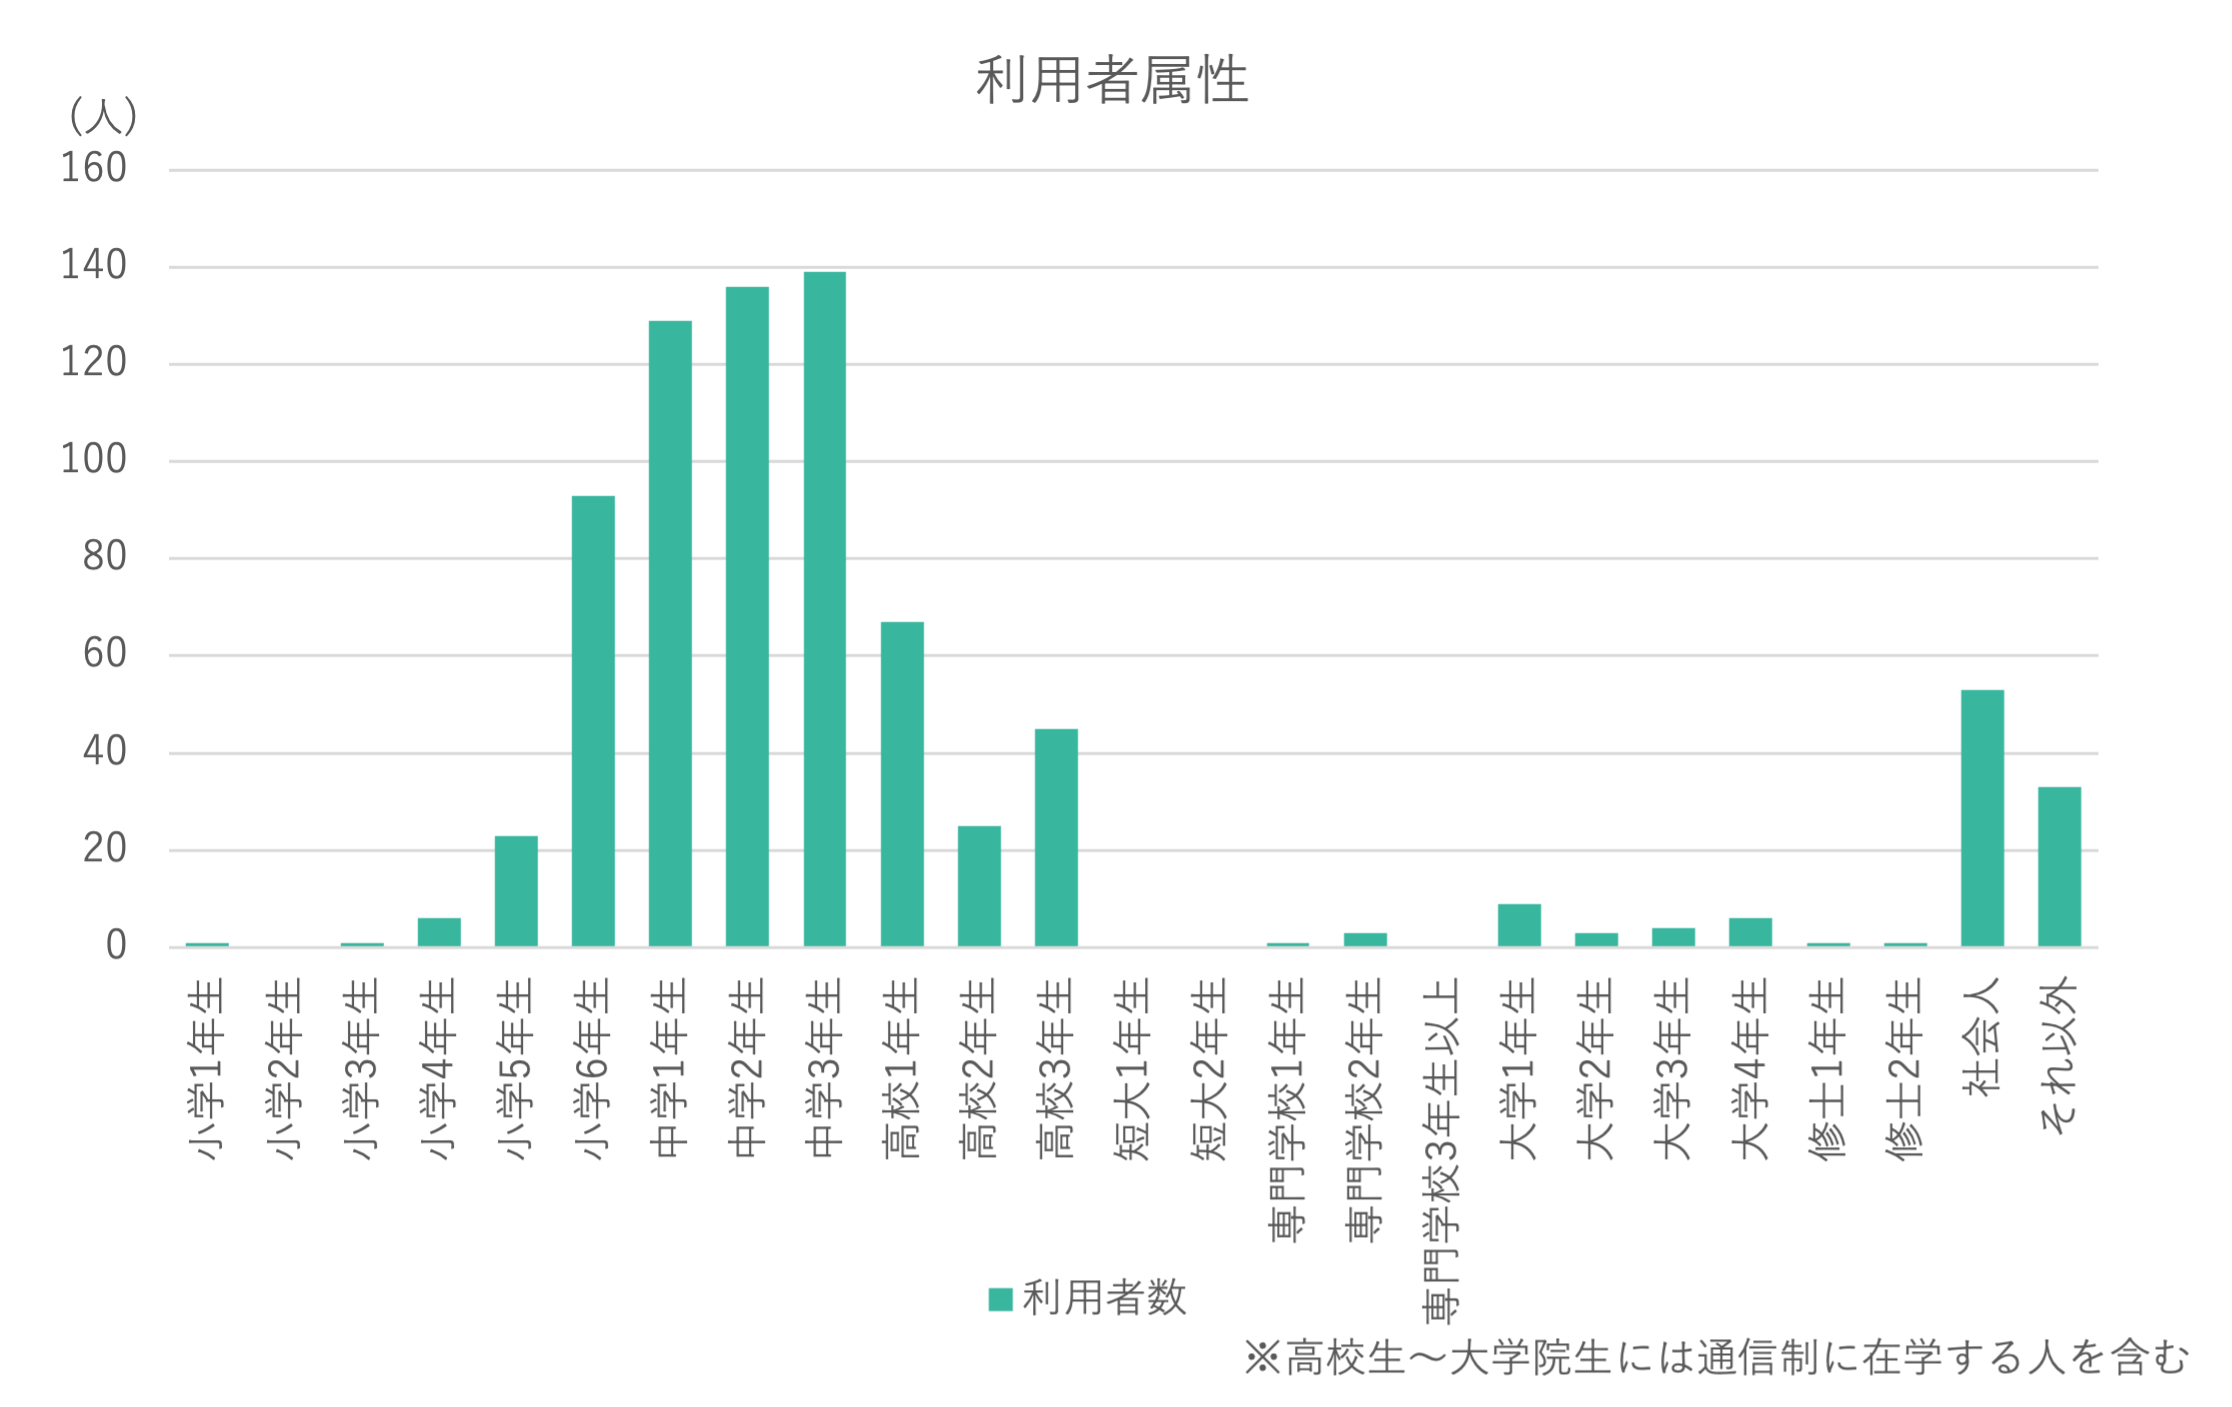
User Demographics
Voluntary survey (as of April 2025). Primarily middle school students, ranging from elementary to university.
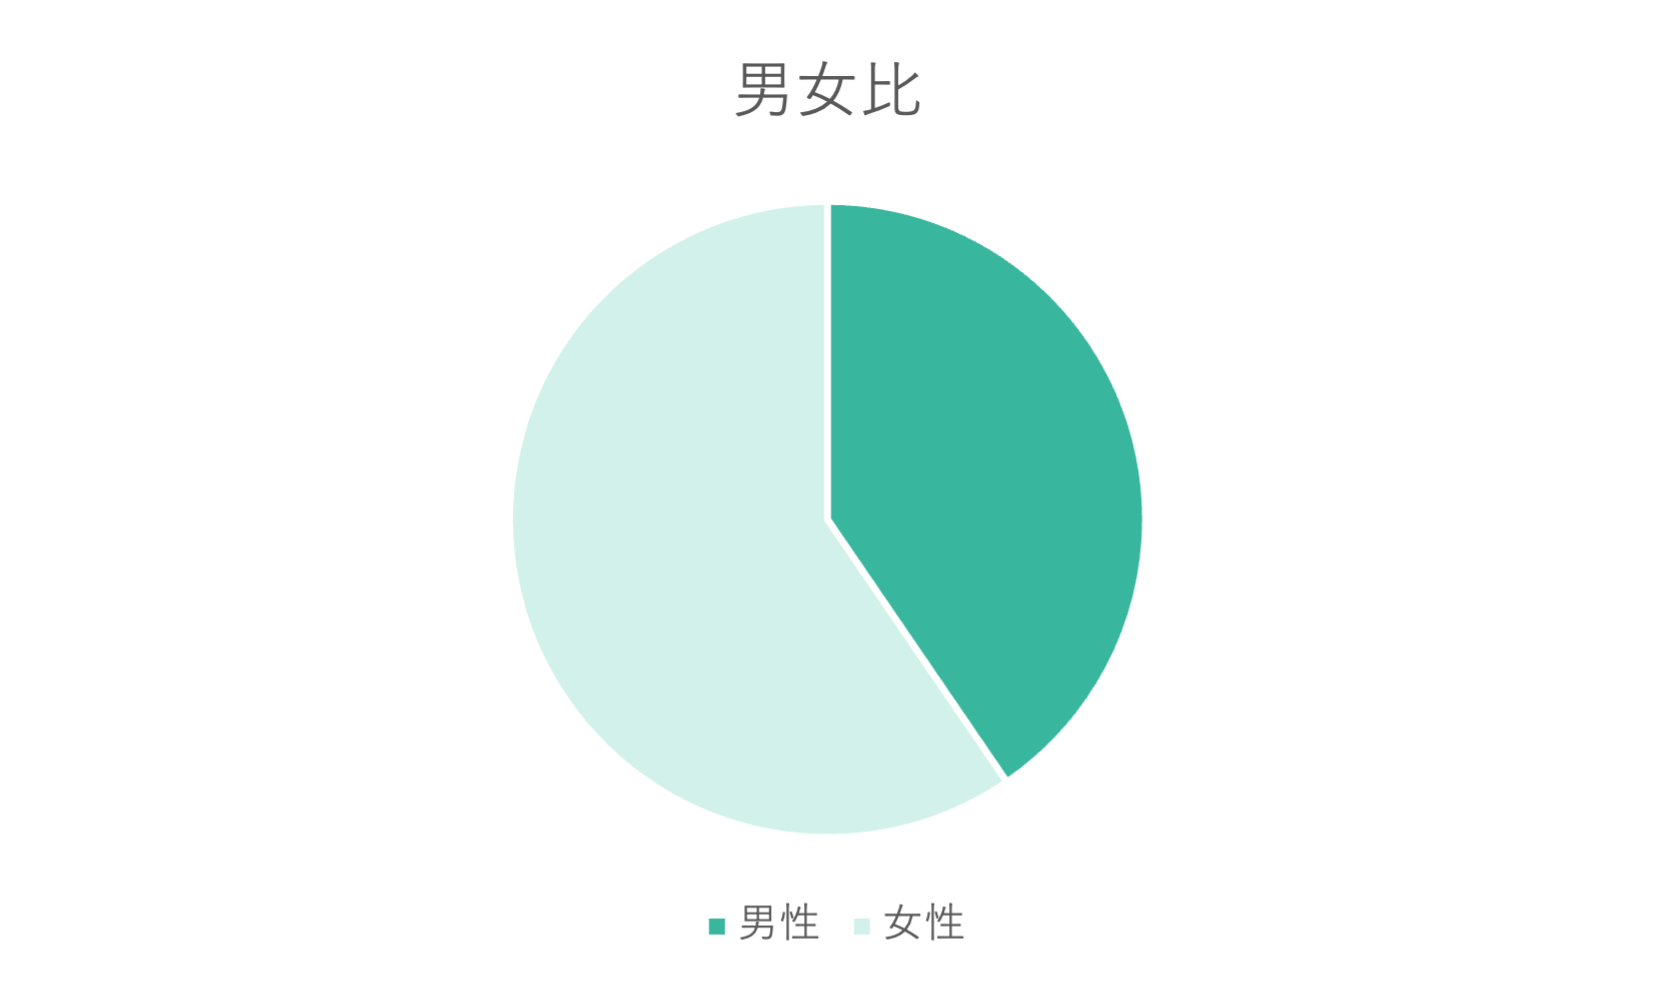
Gender Ratio
More male users than comparable services (as of May 2025).
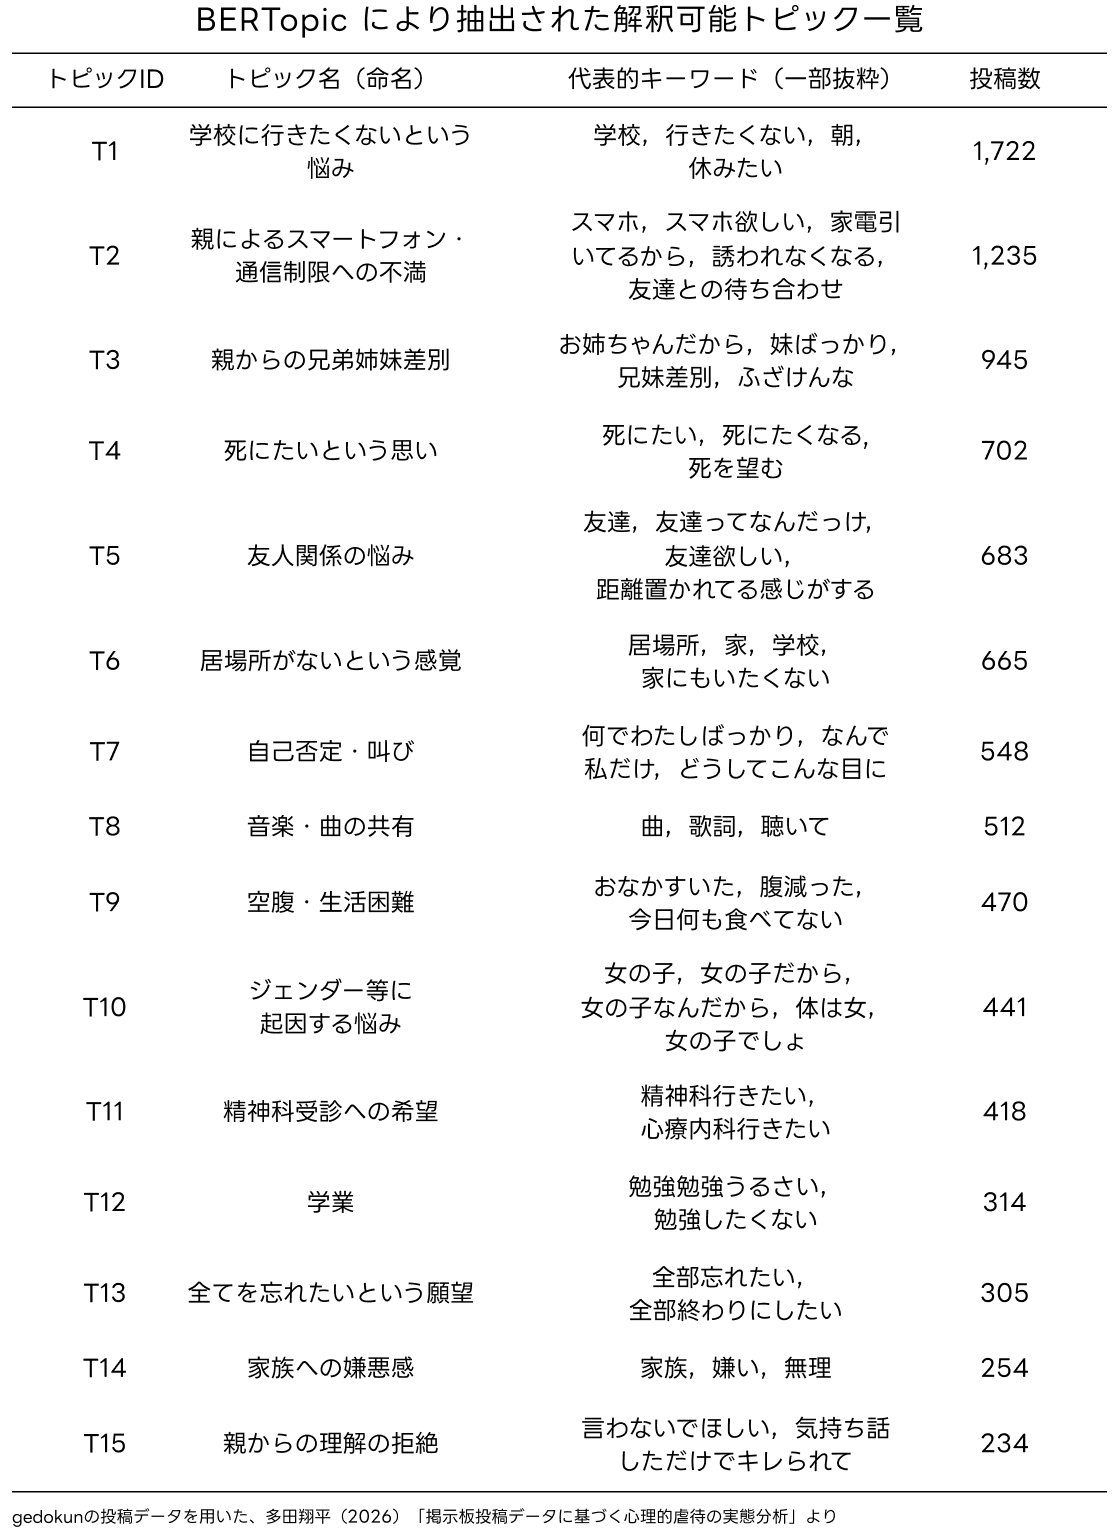
Topic Analysis
Analysis of the most common topics across 120,000 posts from 2021 to June 2025. Topics such as not wanting to go to school, sibling discrimination, and suicidal ideation were identified.
※ Based on Tada (2026) “Analysis of psychological abuse based on bulletin board post data”
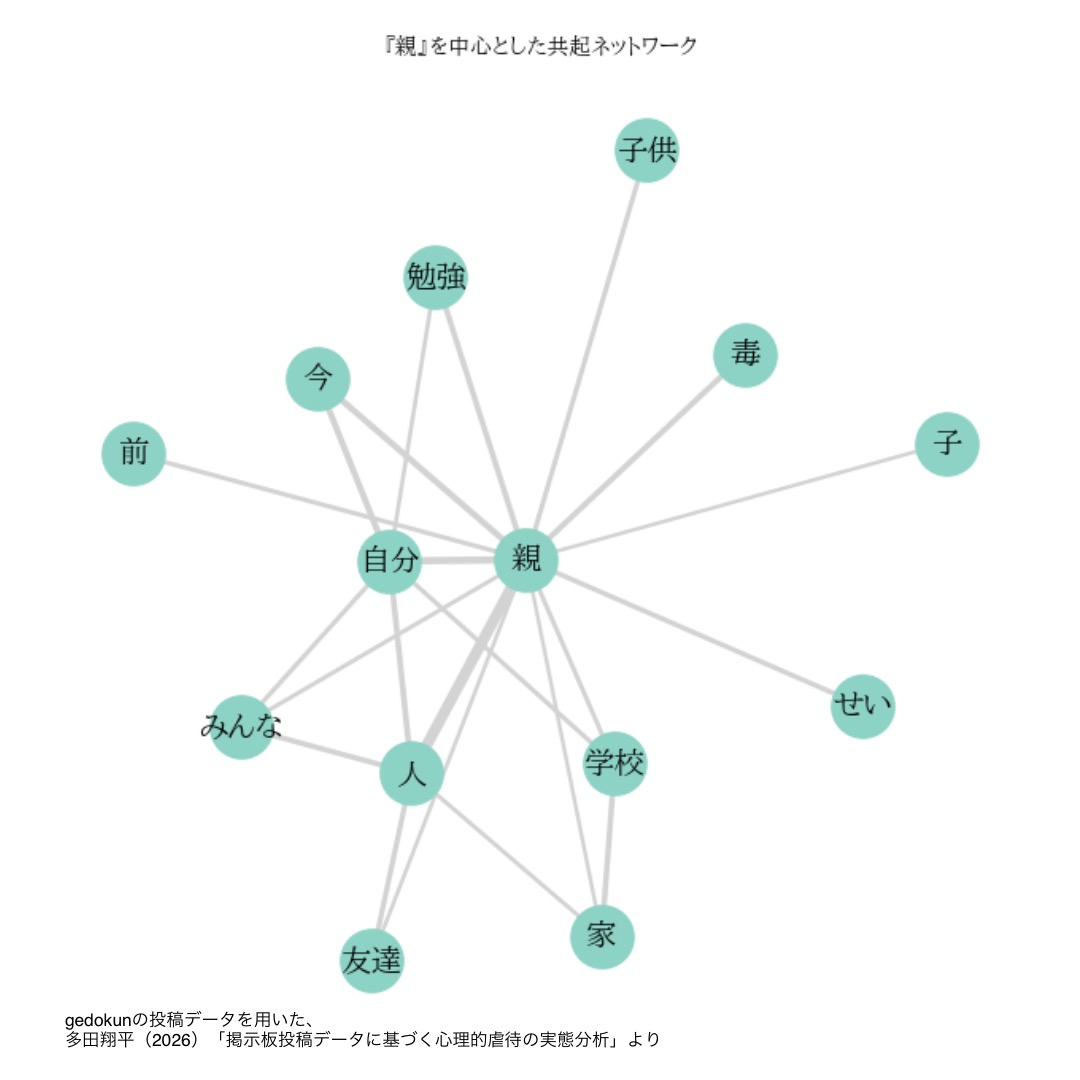
Co-occurrence Network
Based on 120,000 posts from 2021 to June 2025, visualizing which words appear together centered on “parents.” Suggests many struggles relate to the parent-child relationship.
Based on Tada (2026) “Analysis of psychological abuse based on bulletin board post data”
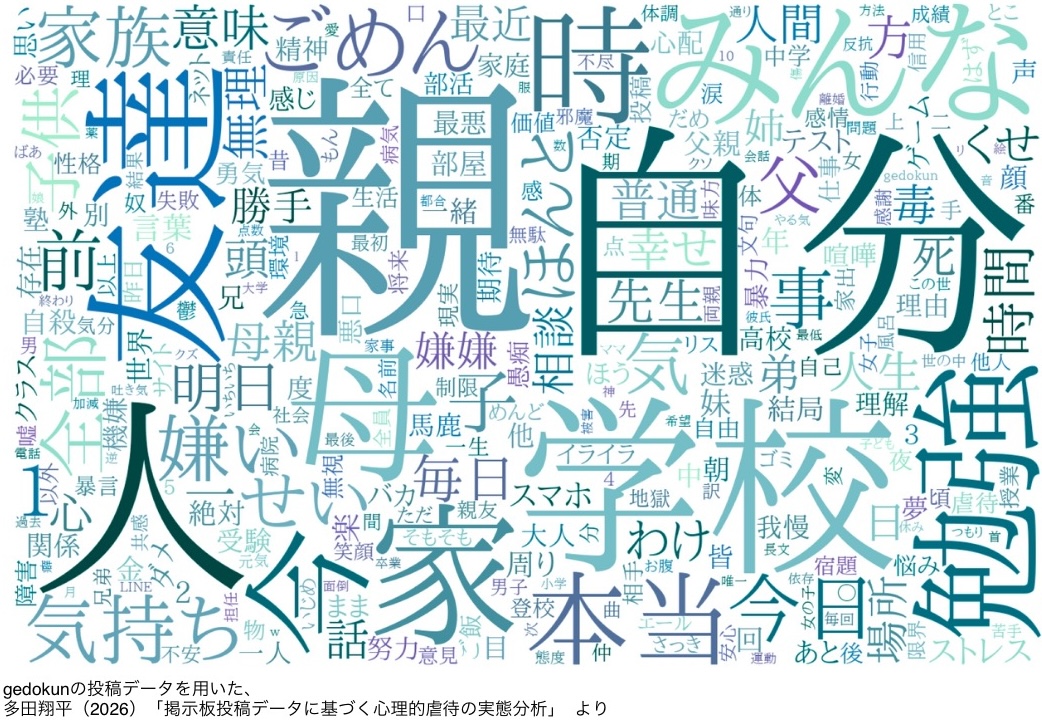
Word Cloud
Frequent words from 120,000 posts visualized by font size. Posts about parents are central, but school and friends also appear frequently.
※ Based on Tada (2026) “Analysis of psychological abuse based on bulletin board post data”
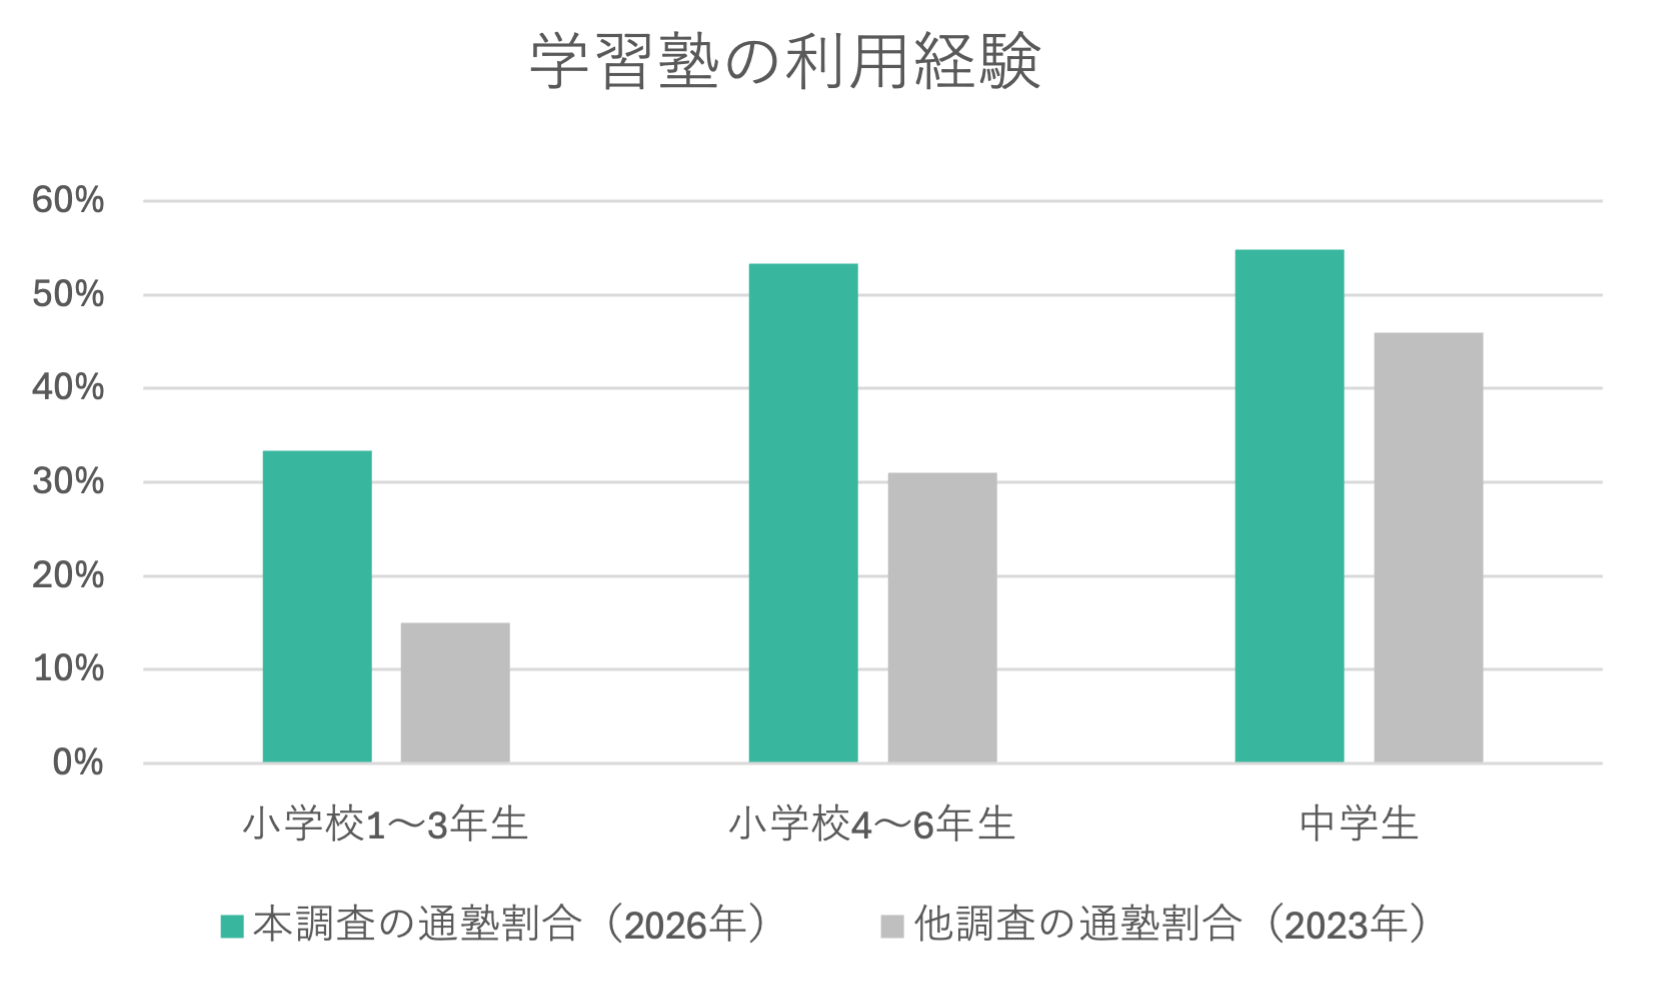
Cram School Usage
Approximately 30–50% attend cram school (as of February 2026).
Note: Comparing results from different survey years (2023 and 2026); direct comparison has limitations.
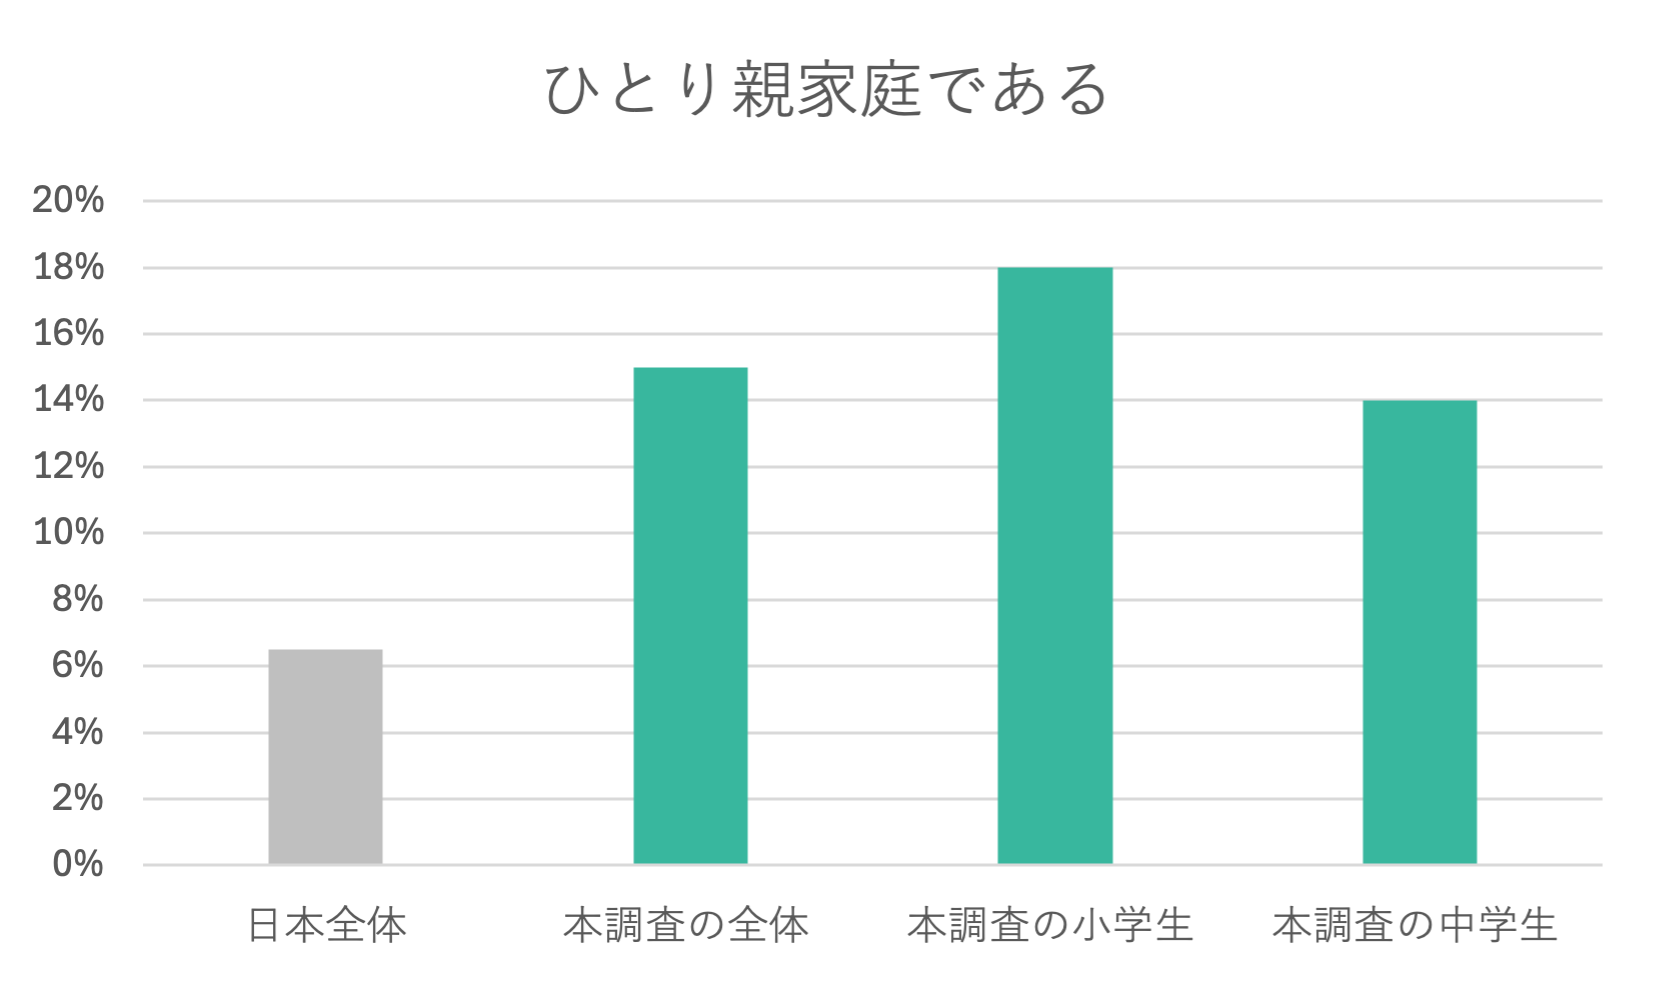
Single-Parent Household Rate
15% of users are from single-parent households (as of February 2026).
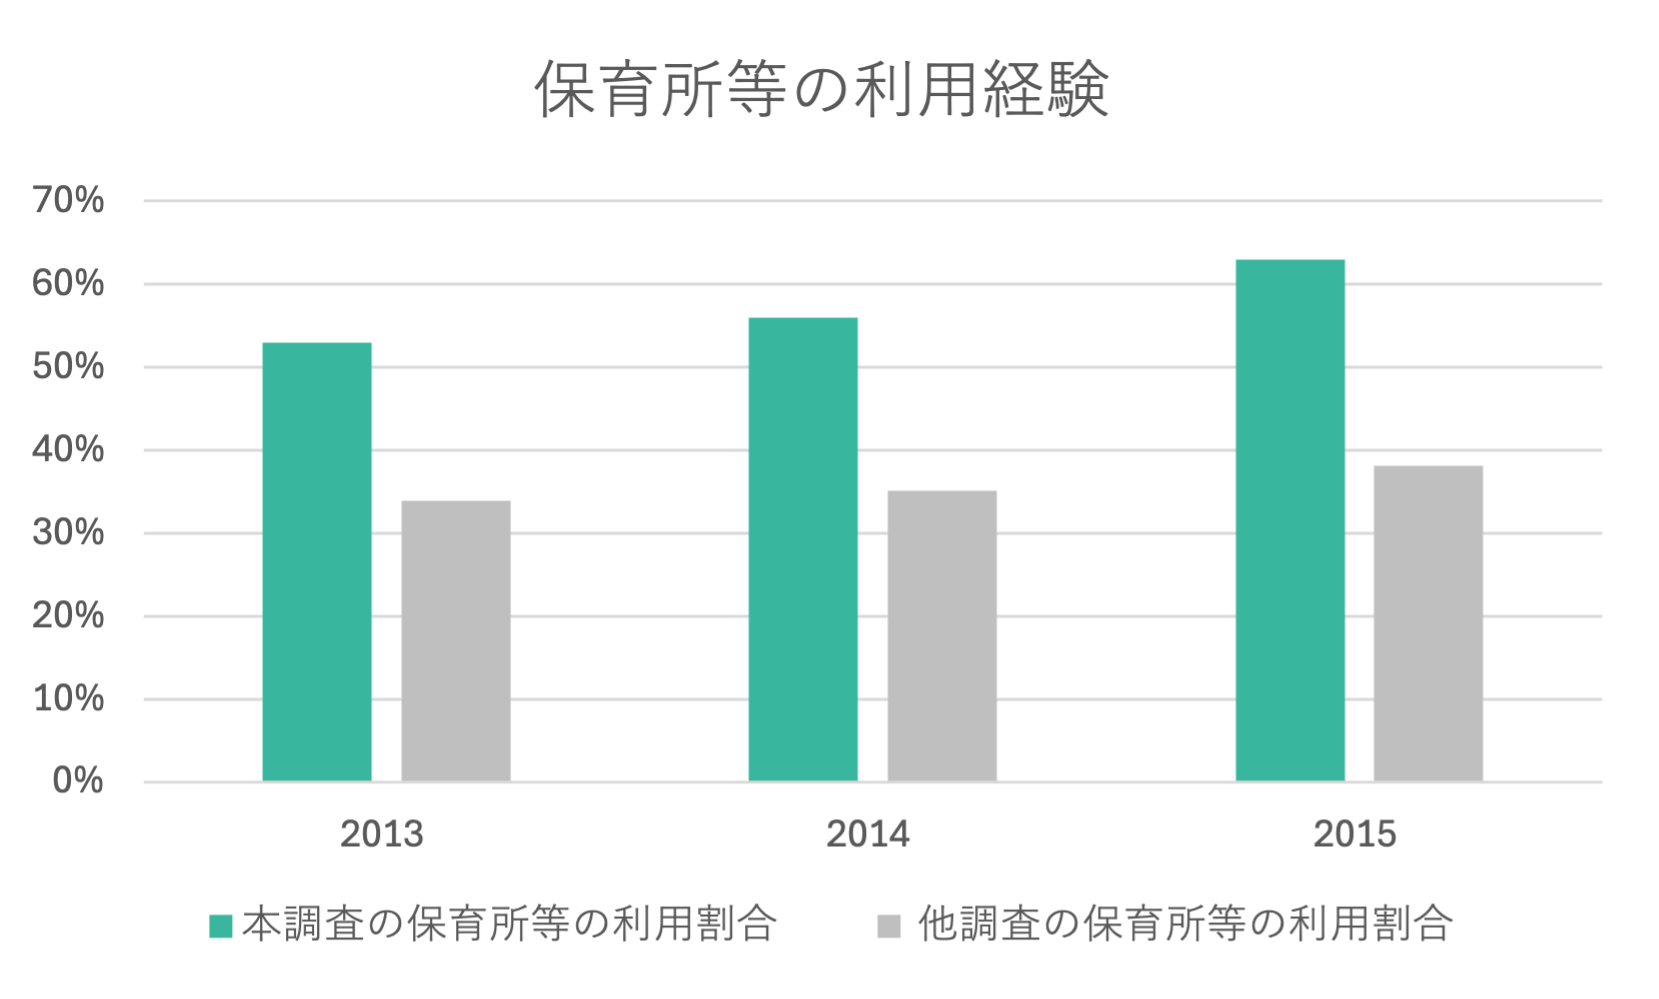
Daycare Usage
Daycare usage is approximately 20 percentage points higher than other surveys (as of February 2026).
Note: Retrospective survey format; memory accuracy has inherent limitations.
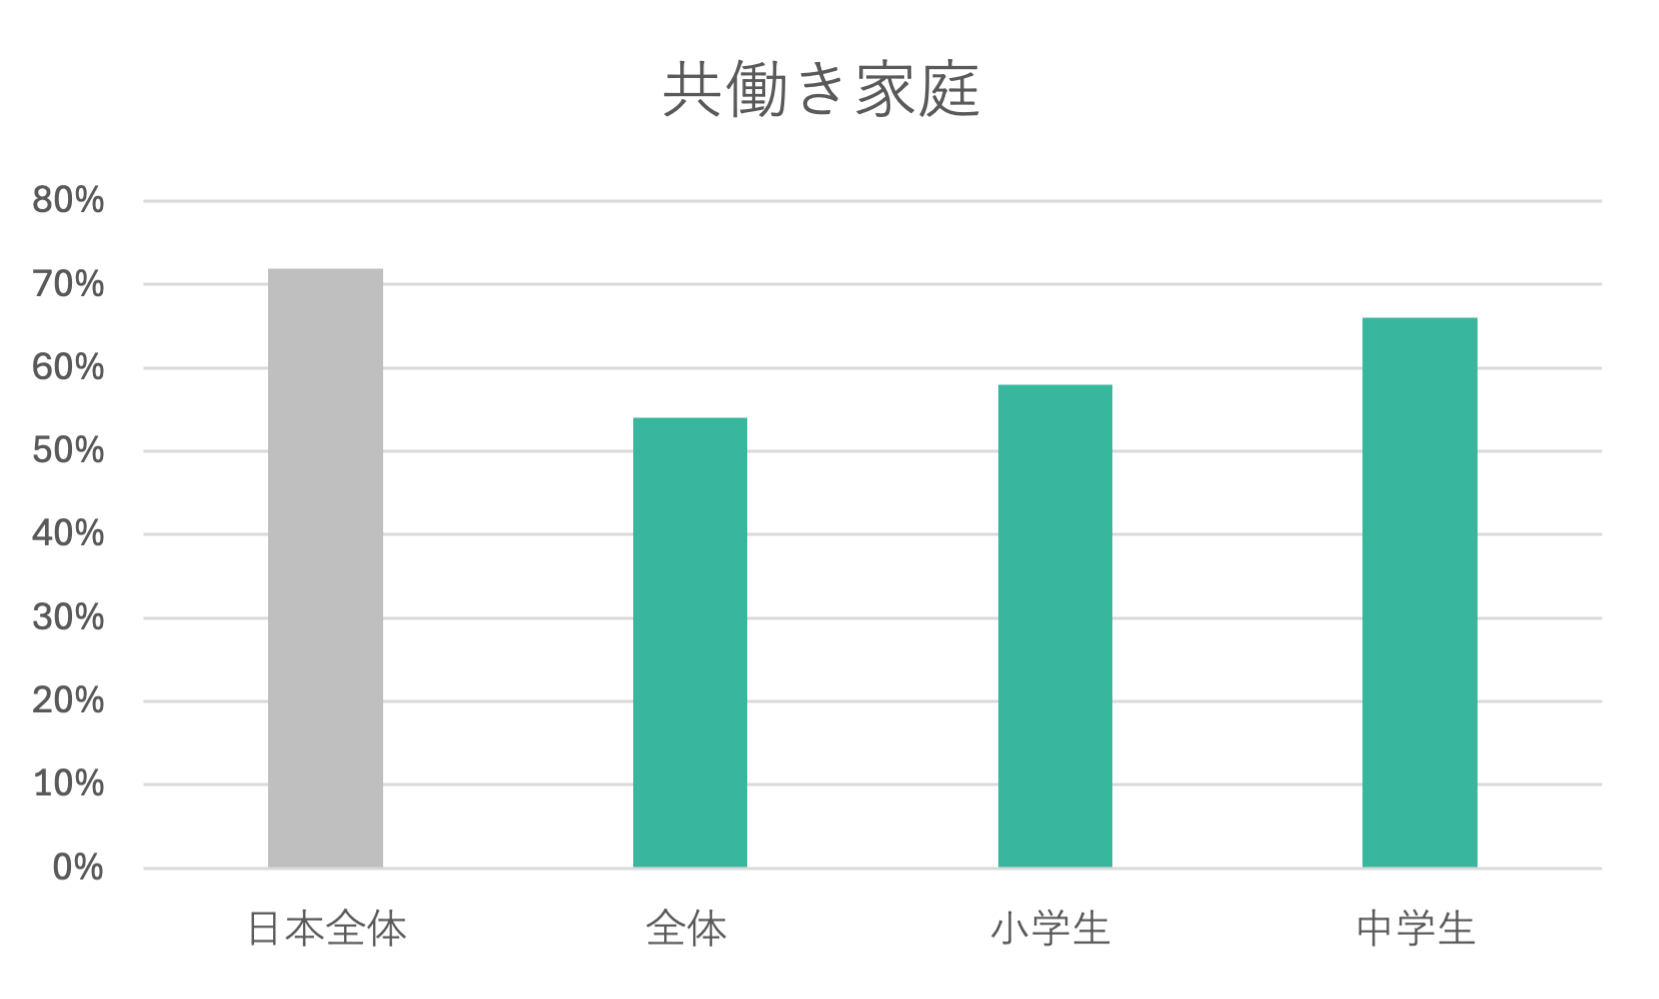
Dual-Income Household Rate
54% of users are from dual-income households (as of February 2026).
Note: This survey targets child-rearing households, while the comparison statistic covers all married couples including elderly non-working households.
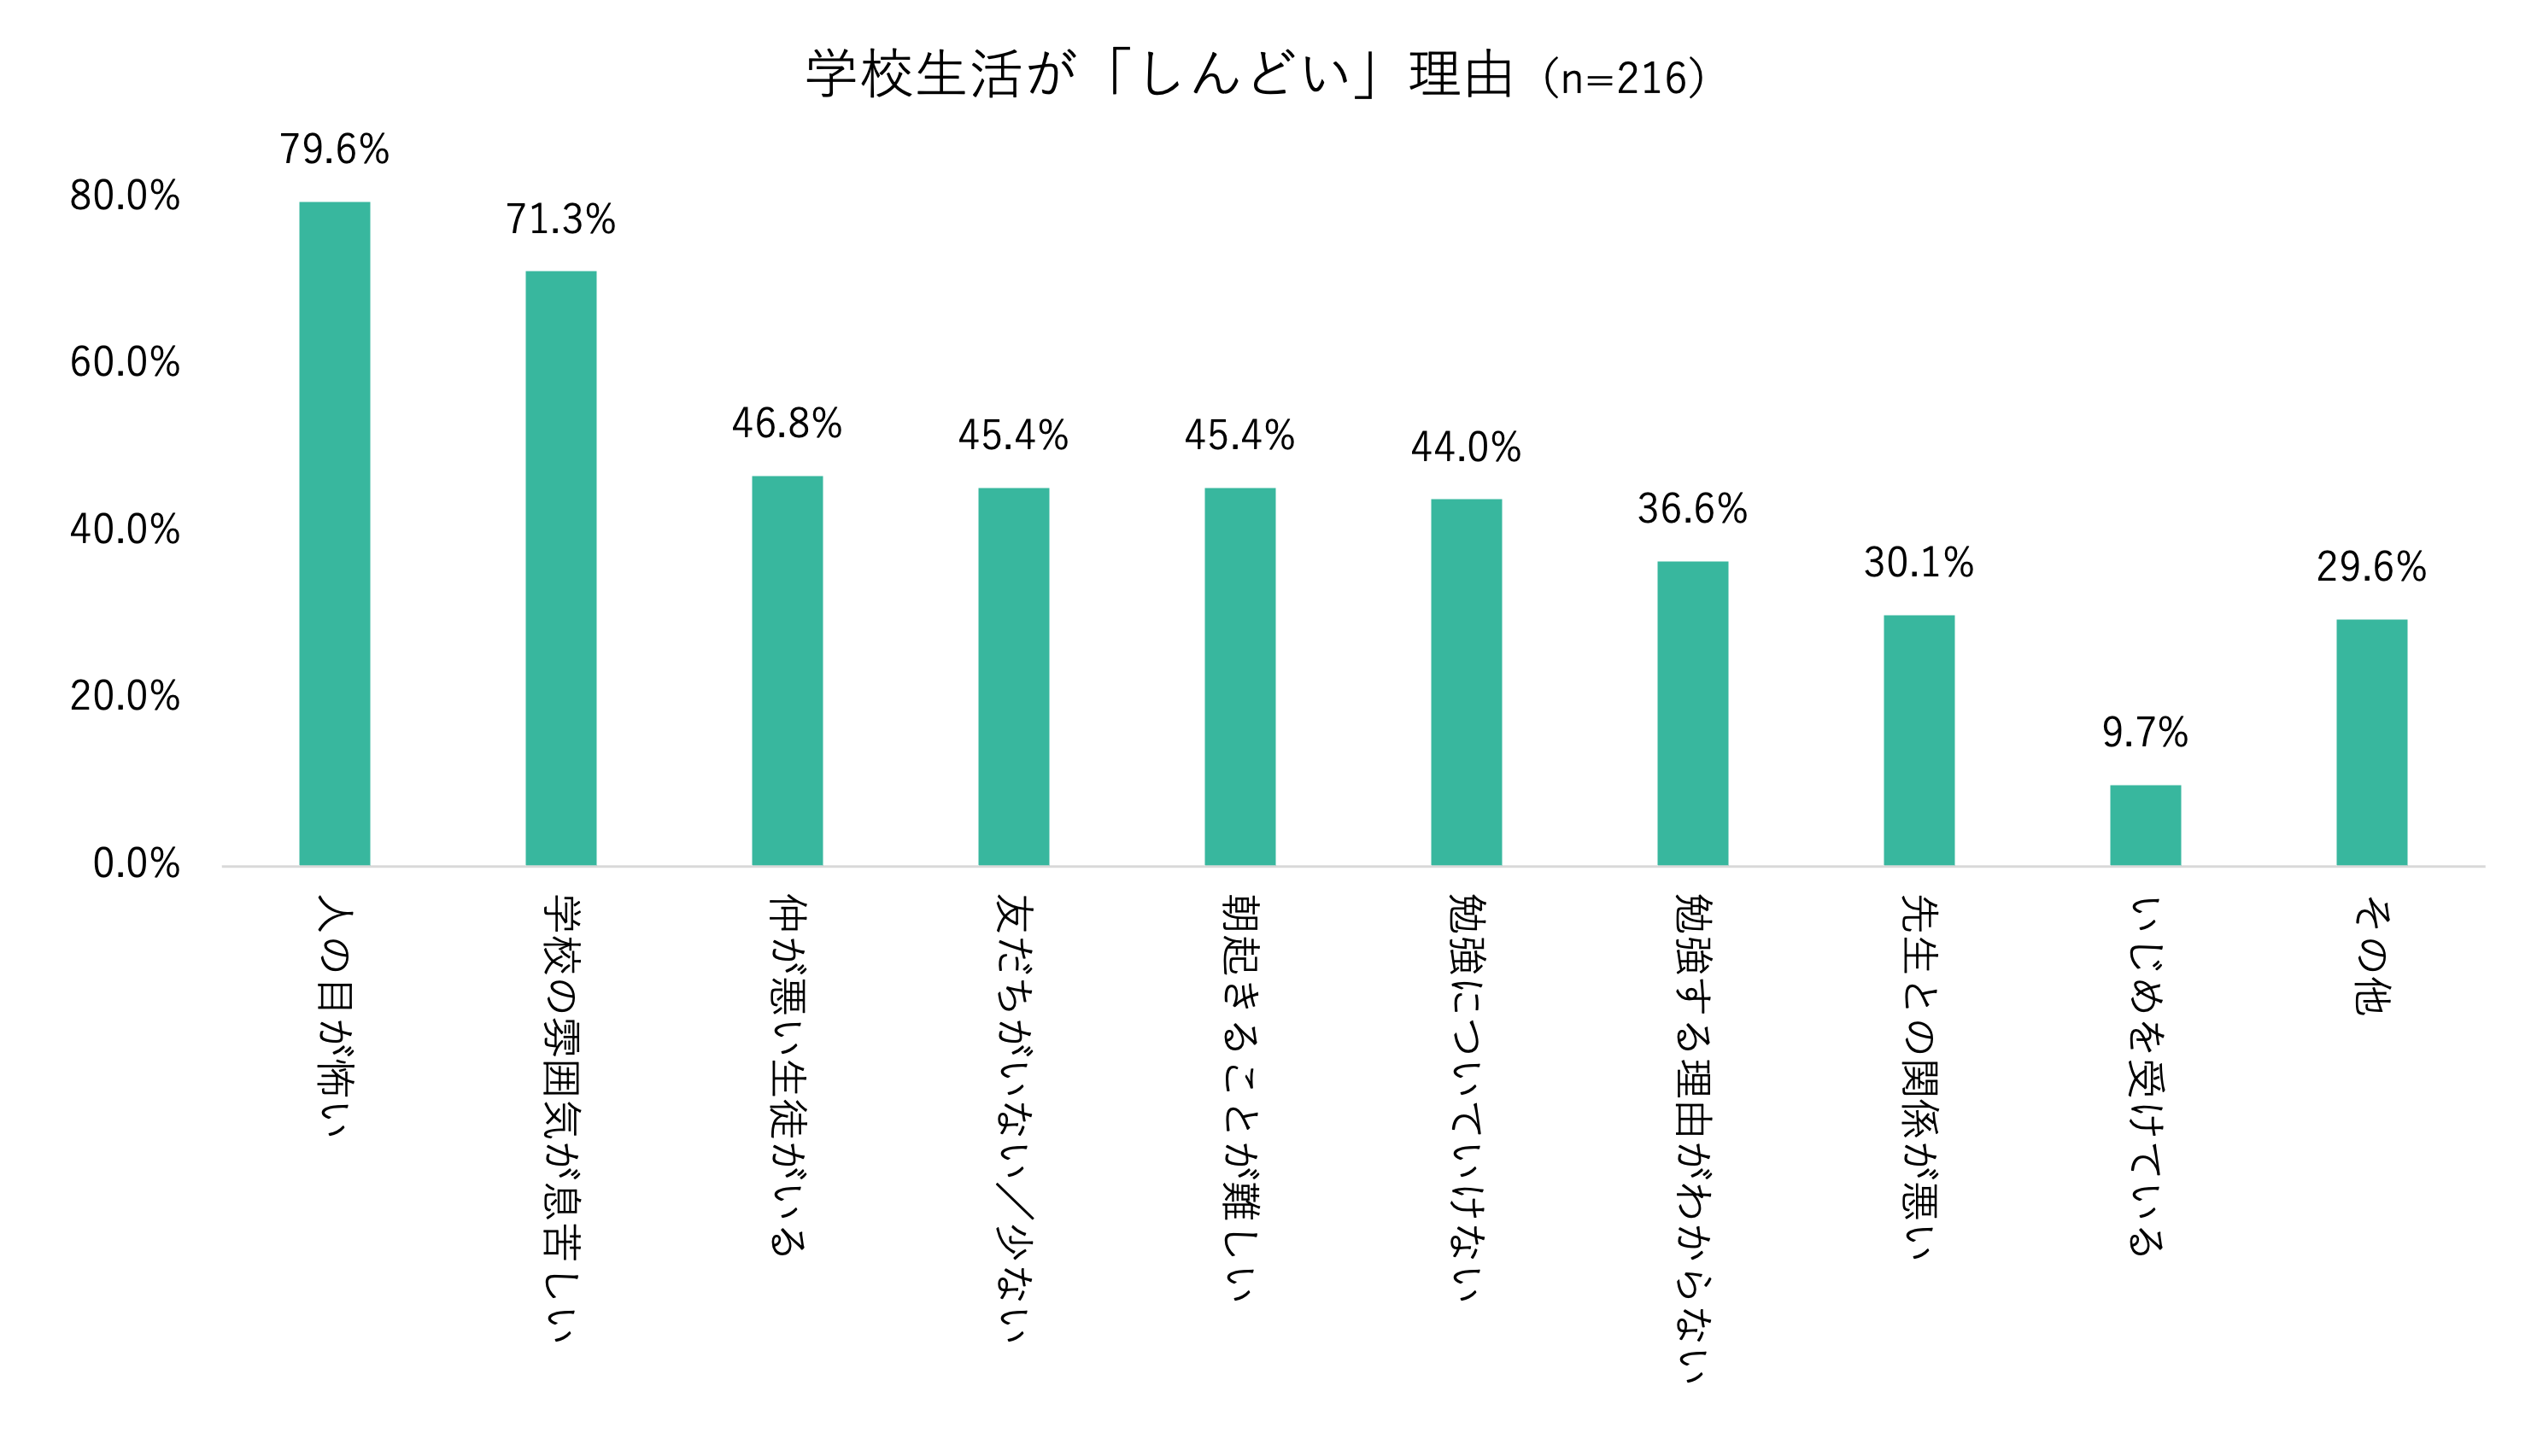
Why School Life Is Hard
"Scared of others' judgment" and "school atmosphere is suffocating" (July–August 2025).
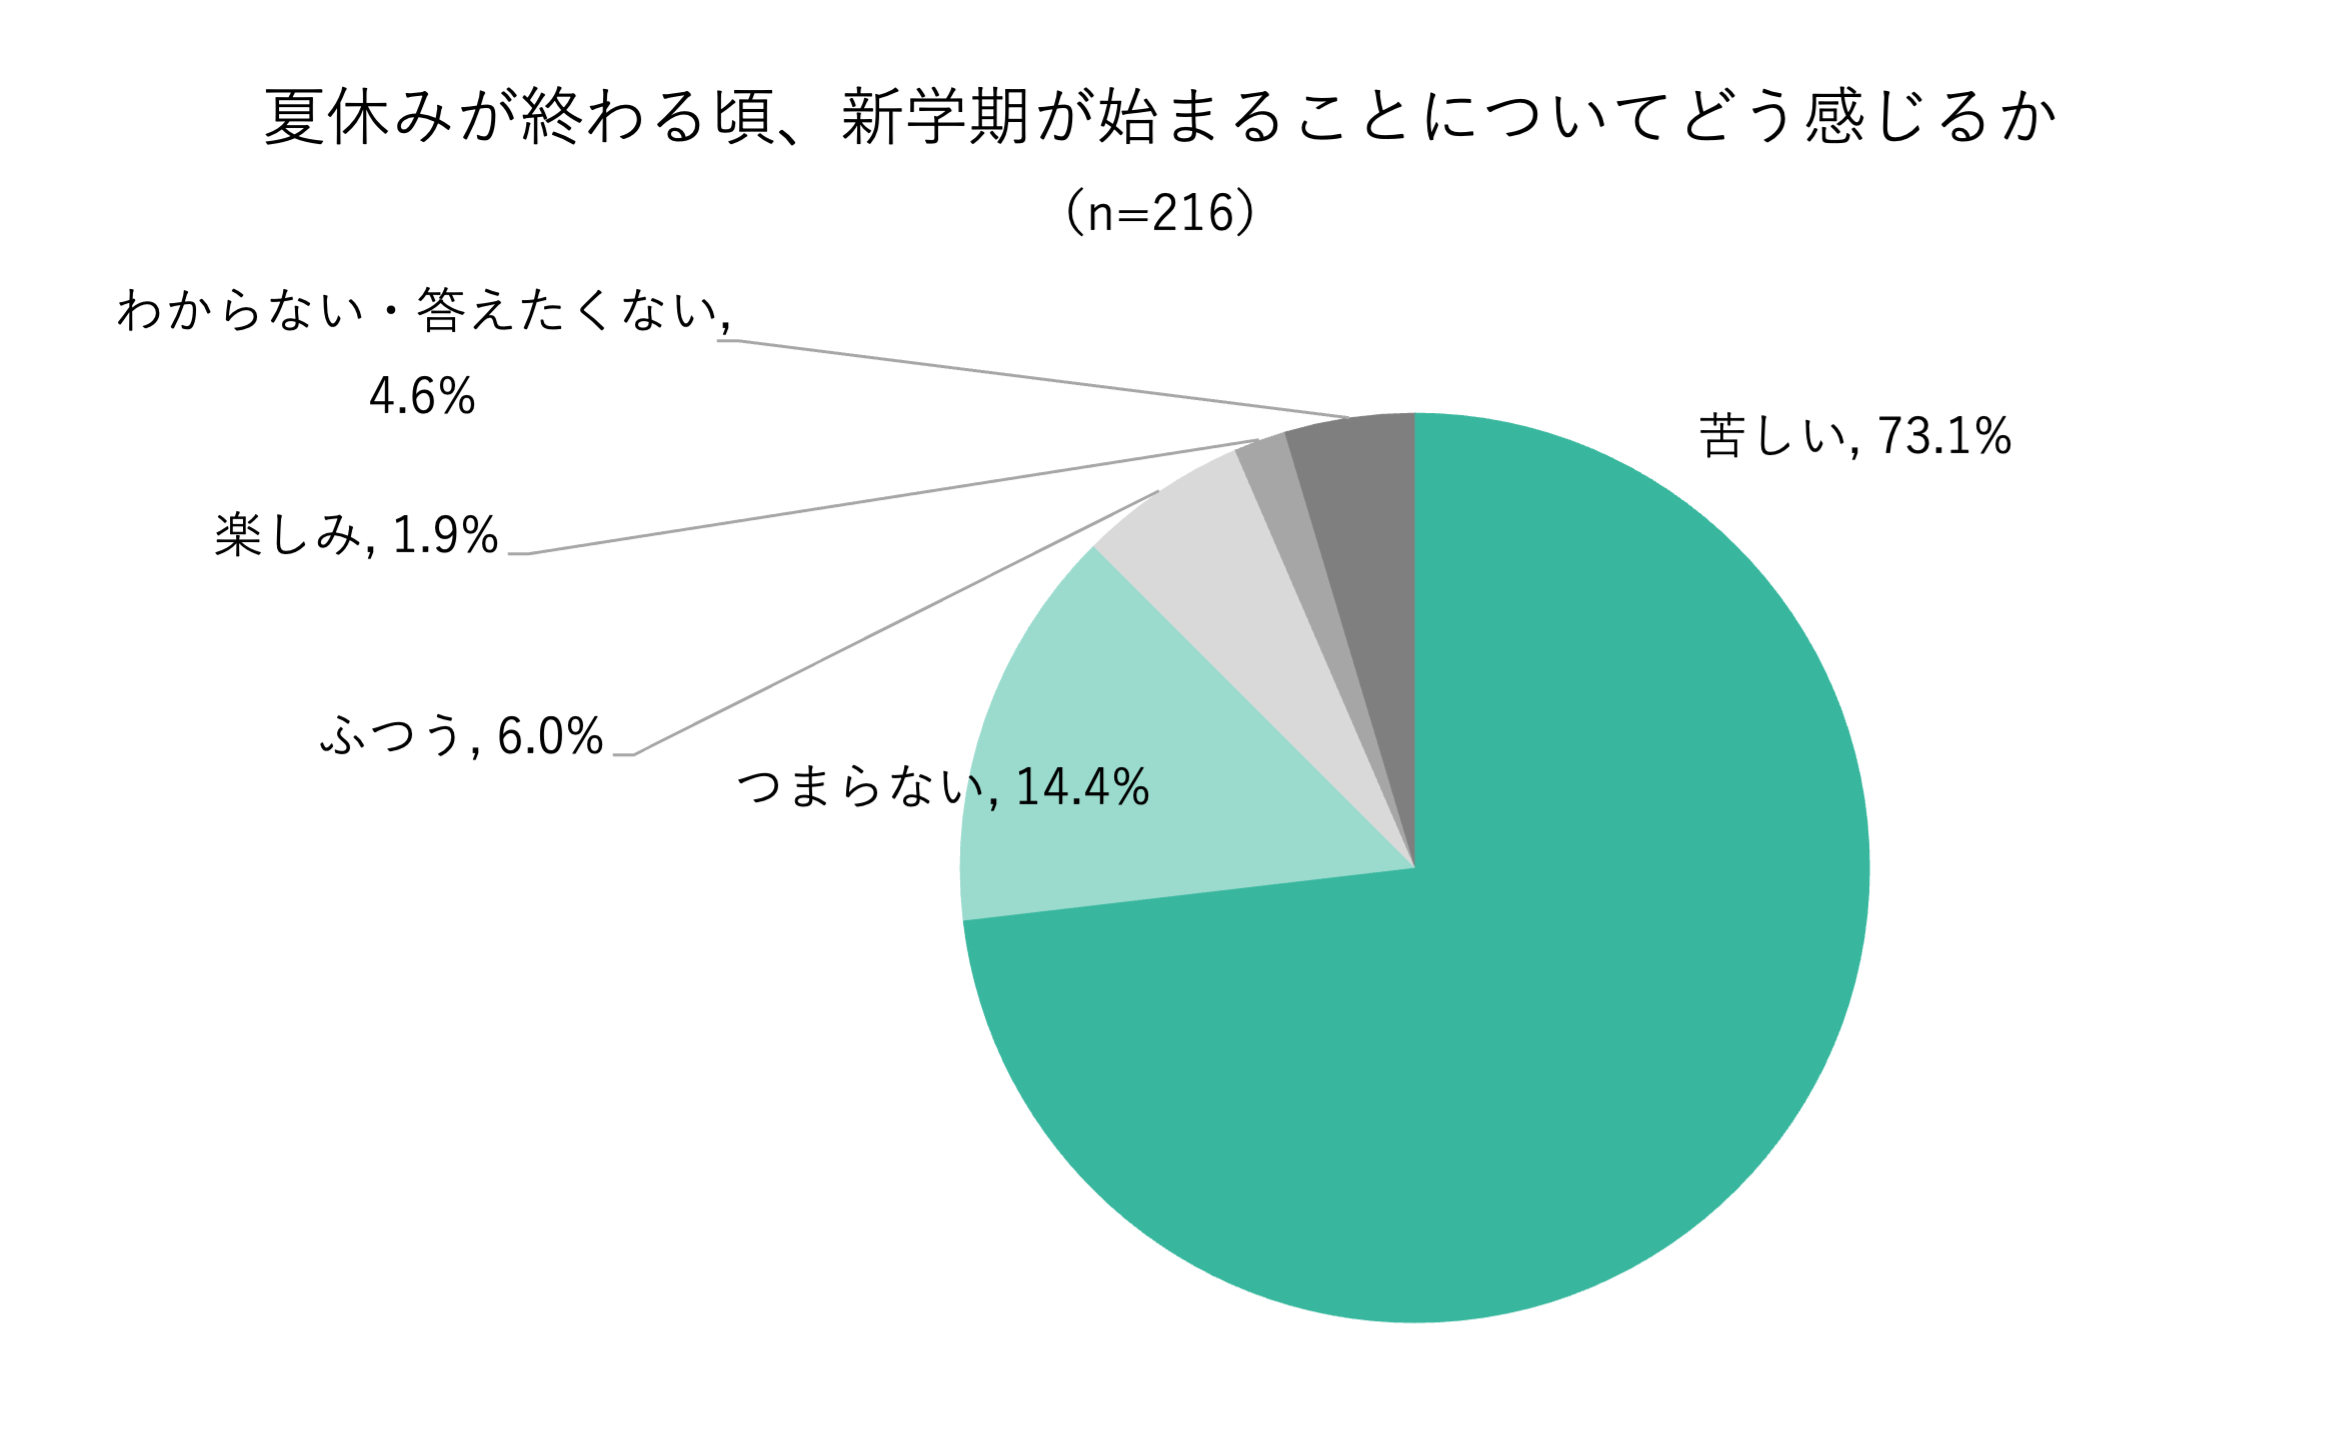
Suicidal Ideation at End of Summer Break
93% have felt like "disappearing from this world" as summer break ends (July–August 2025).
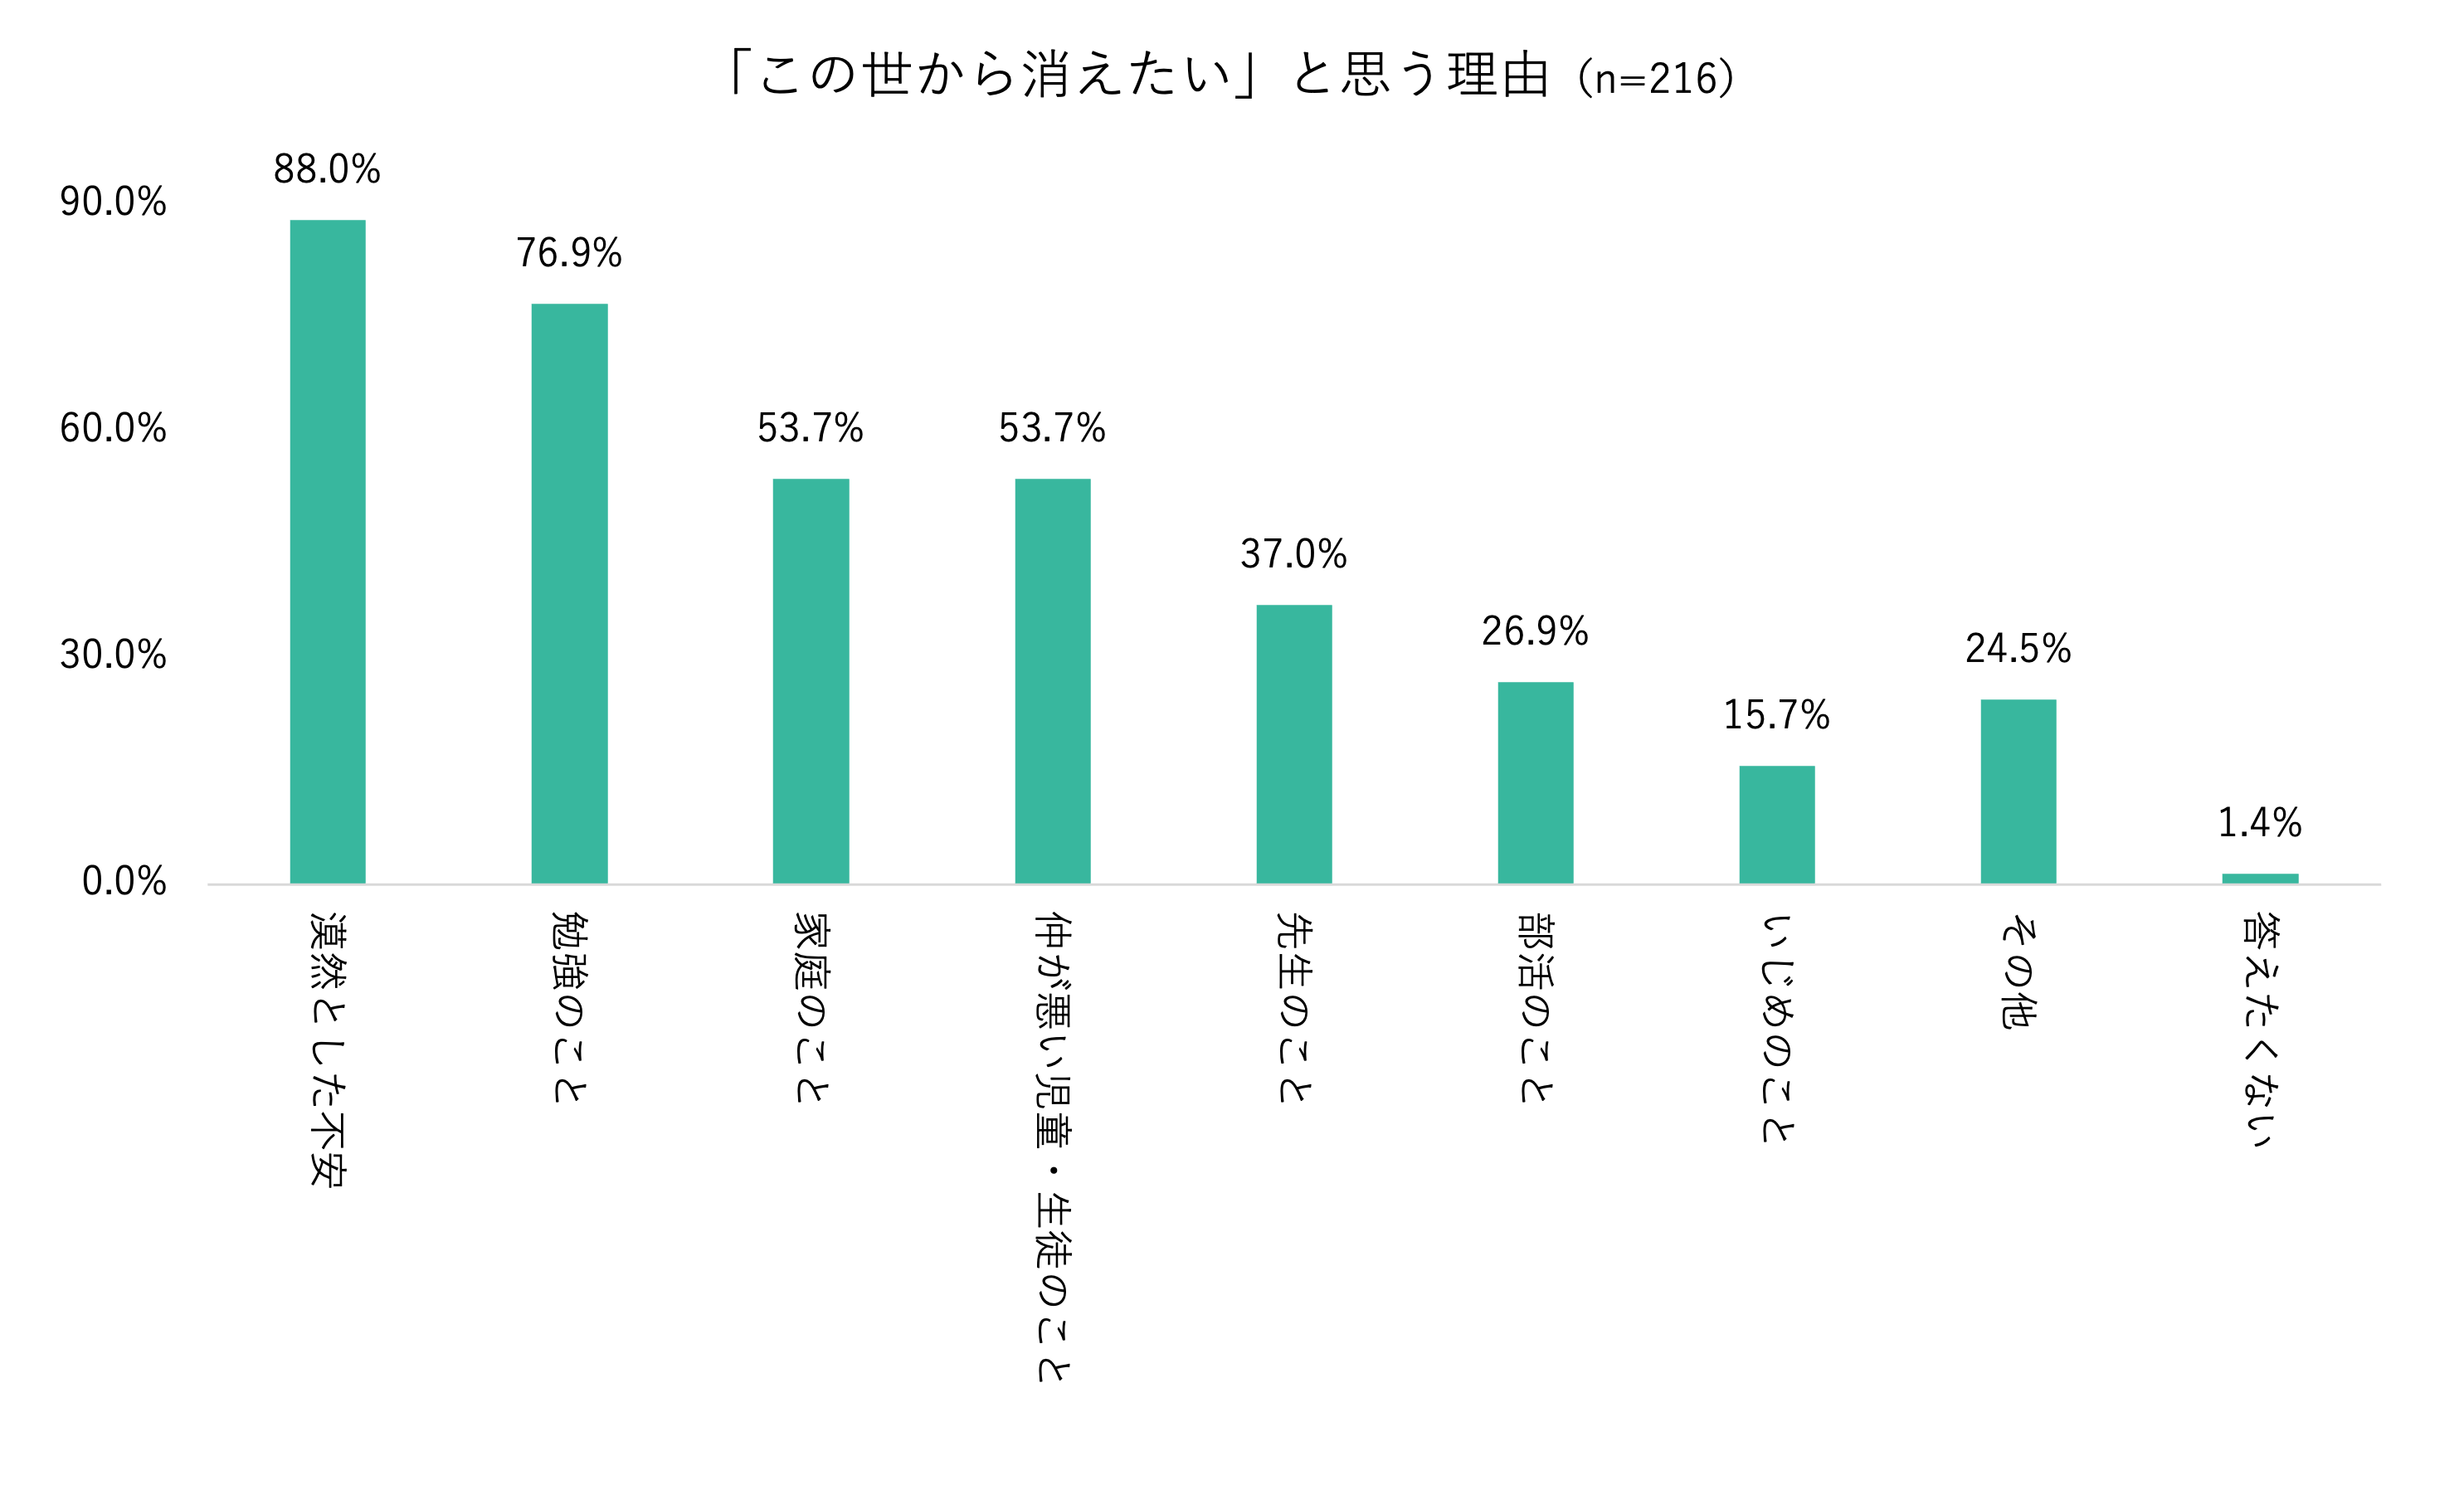
Reasons for Wanting to Disappear at End of Summer Break
"Vague anxiety," "studies," "family" (July–August 2025).
Career Aspiration Comparison
94% report differences between their own and their parents' career aspirations (as of December 2024).
Note: Based on children's perception of 'what my parents think my future should be', not direct parental responses.
The Importance of Stages 0 and 1
The help-seeking stage model identifies “Stage 0: unrecognized, unexperienced difficulty” and “Stage 1: experienced, recognized difficulty.” The Third Family focuses on Stages 0 and 1.
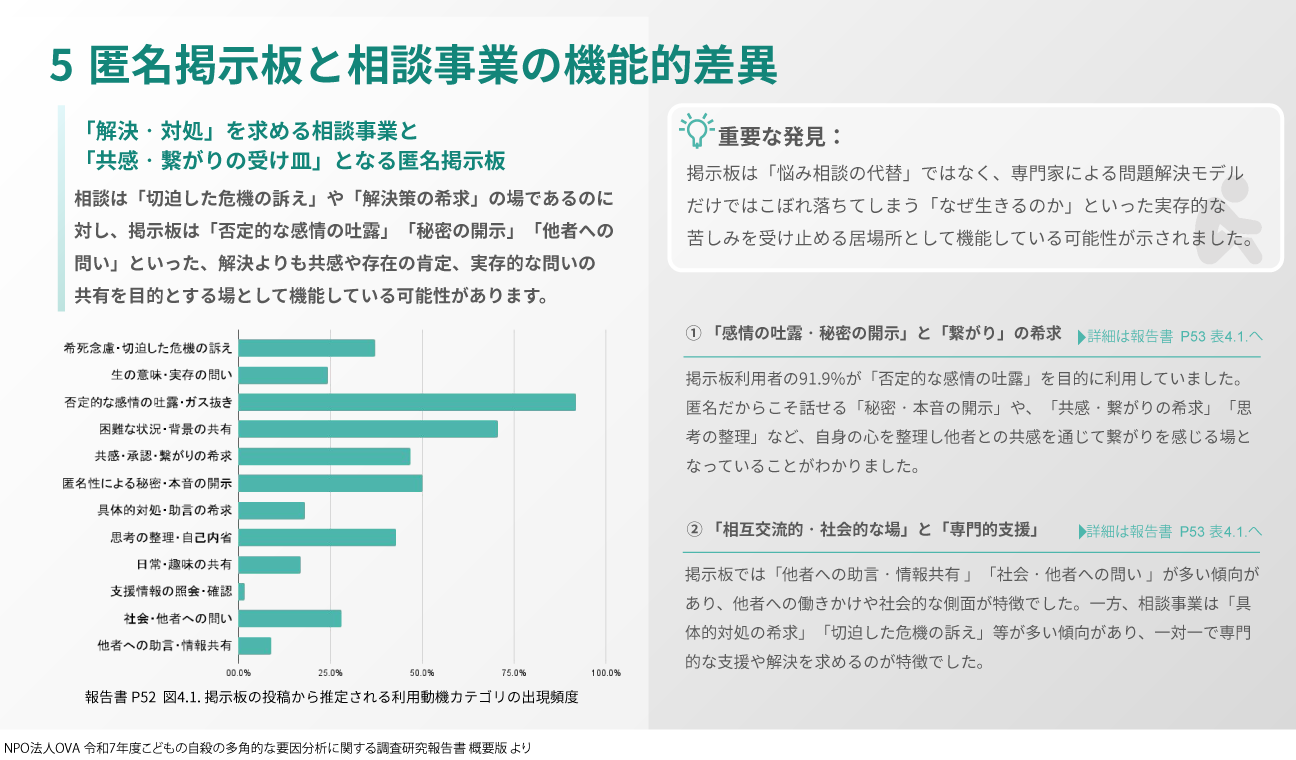
The Functional Difference Between Anonymous Bulletin Boards and Counseling Services
The findings suggest that bulletin boards do not function as a “substitute for counseling,” but rather as a place that can hold existential suffering — such as “why am I alive” — that falls through the cracks of expert-led problem-solving models.